July Economic Update: Mixed Economic Data and What History Tells Us About Investing at Market Peaks

Economic Data: Getting Cooler

Despite the recent heat wave roiling the U.S., this month also brought data supporting the Fed’s soft landing narrative. May’s CPI was cooler than expected, with core CPI at its lowest since August 2021. Likewise, pending home sales were at their slowest pace since 2001. The May Core PCE reading of 2.6% over the past twelve months met expectations. Economists broadly expect price pressures to continue to fall in the latter half of 2024, with further consumer goods discounting in June and ongoing disinflation in services. Alas, the data was not ice cold: May nonfarm payrolls and average hourly wage data exceeded expectations, which bolsters the Fed’s case for sticking with the higher-for-longer stance.

Given the disinflation trend, cooling labor markets, and weaker economic data, markets are now pricing in a 67% chance of a September rate cut, up from 45% at the beginning of the month. The June FOMC meeting concluded with projections indicating just one rate cut this year, down from three projected in March.

Investing at the Top: Should you wait for a pullback?

One of the most common challenges for investors is timing. Behavioral finance research suggests that we often fall prey to a phenomenon known as “Anchoring”, where we consciously or unconsciously use a fixed reference point (the “anchor”) as the context for determining relative value. This can be helpful in short term decisions, such as determining which cuts of steak are on sale when shopping for a holiday barbecue. However, this bias is less helpful for long-term investing as it often leads to investors sitting on the sideline while waiting for the “right” time to commit.

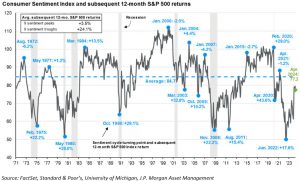
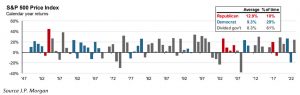
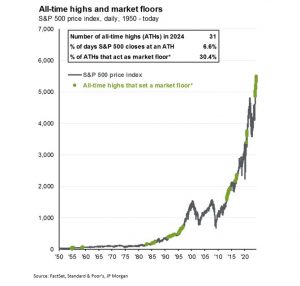
Many investors look at the current price of an index, like the S&P 500, and see reports of all-time highs as a reason to wait. However, research indicates that investing at all-time highs is a reasonable strategy. Market highs tend to occur in clusters and strong performance runs are often followed by further highs.

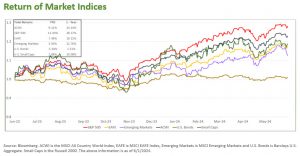
Since the start of the year, there have been a whopping 31 new all-time highs in the S&P 500. As one will note looking at the chart below, historically 30% of the time these all-time high moments created a new “floor” (highlighted in green) which the market subsequently didn’t fall below. Indeed, research done by JP Morgan indicates that investors who bought at S&P 500 peaks since 1950 did better in the 1-, 2-, 3-, and 5-year periods that followed compared investors who bought at the average price during each of those periods.

Investors waiting for an ideal moment often miss out on the opportunity to participate in rising markets. Missing even a small number of days in any given market cycle tends to result in lower returns compared to those who remain fully invested. As we have noted previously, missing the 30 best days in the S&P 500 over the last 30 years would have resulted in less than half the return of those who were fully invested over the entire time period.

Investors with a long time horizon should heed the adage “Time in the market is more important than timing the market”.


Capital Markets

In June, enthusiasm for AI was evident as Nvidia surpassed Microsoft mid-month to become the world’s most valuable company. However, Nvidia’s shares subsequently dropped over 15% due to concerns about extended valuations, an overcrowded trade, and a concentrated revenue base. Meanwhile, Apple’s shares rose nearly 10% after announcing several AI integrations into its platforms, including a partnership with OpenAI to incorporate ChatGPT into Siri and other applications.

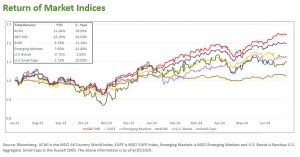
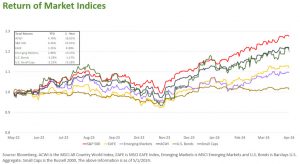
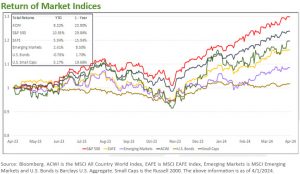
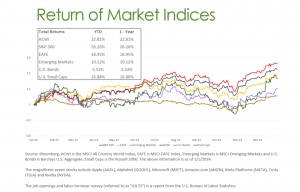
Equity returns were mixed in June. The All-Country World Index (ACWI) rose 2.3% and the S&P 500 rose 3.6%, while the EAFE and U.S. small caps fell -1.6% and -0.9%, respectively. There continues to be a wide dispersion both in valuation and performance between the large and small cap stocks. Emerging markets rebounded upward nearly 4% after falling last month on slower growth expectations in China.

June Economic Update: Big Tech has a Big Month and Trade Settlement gets Shorter

Big Tech: Big Earnings

The S&P 500 constituents closed out the first quarter with strong earnings. The Q1 blended growth rate for S&P 500 companies reached 5.9%, the highest since Q1 2022 and significantly above the 3.4% analysts expected as of March 31.

Notably, when excluding the “Magnificent 7” companies, the blended earnings growth rate for the rest of the S&P 500 was -1.80%. Those 7 stocks alone swung the S&P 500 earnings by over 7%! In that context, it doesn’t seem unreasonable for the companies generating a disproportionate amount of earnings to see a disproportionate amount of affection from investors. Accordingly, in May, “Big Tech” stocks posted outsized gains relative to the rest of the market, with more than half of the S&P 500’s returns coming from NVIDIA (+27%), Apple (+13%), Microsoft (+7%) and Alphabet (+6%).

The Evolution of Trade Settlement

Effective May 28th, U.S. security trades shortened standard trade settlement to one business day (T+1) from two (T+2). For those unfamiliar with the term, the settlement period is the time between when a security is bought or sold and when the trade is considered final. During this window of time, the buyer must make the payment and the seller must deliver the securities.

The change received little attention from the media, however it has subtle but important ramifications for investors. To understand why, we need to look at a brief history of stock trading in the U.S.


The New York Stock Exchange began trading in 1817 with paper stock certificates which would require physical delivery for the next 150 years. In the early years, settlement could take up to 30 days. By 1952 train and airplane travel shortened settlement time to just two days (T+2). However, as overall volume of trading increased, settlement times became longer and a surge in trading in 1968 overwhelmed Wall Street with paperwork. Five business days settlement became the norm due to a shortage of couriers to transport bags of checks and stock certificates. This led to frequent Wednesday closures to settle trades.

With the advent of fax machines and the 1973 founding of the Depository Trust & Clearing Corporation (DTCC), electronic book entry transfer of securities allowed settlement periods to shorten. By 1993, the standard settlement time improved to three business days (T+3), a standard that remained for another 24 years until it dropped to two business days (T+2) in 2017. (Readers who noted the timeline above may be amused to note that it took 55 years of technological advances in processing trades to get back to the same two-day settlement period the U.S. had in 1952!)

Trading volumes continue to rise each year. To address this, securities exchanges have turned to machine learning. This technology analyzes data to identify patterns and allow most trades to settle through “straight-through” processing, where trades are executed, confirmed and settled without human intervention. As AI pushes the boundaries for the speed of crunching large amounts of data, we may eventually see trades settle on the same day.

What does a shorter settlement time mean for investors?

A shorter settlement period has three primary benefits:

  1. Improved capital market efficiency. Shorter settlement times result in increased liquidity, as cash is freed up more quickly post-trade. This gives investors the freedom to reinvest or spend the proceeds from their investments sooner.
  2. Reduced counterparty risk. Shorter settlement time reduces default risk by the other party involved in the trade, as well as the perceived risk of potential for default which can lead to actual illiquidity. A recent example of this was in 2020, where a perceived lack of liquidity in the less newsworthy investment grade bond market led to wild swings in prices. The Fed took the unusual step of announcing they were willing to buy baskets of corporate bonds and backstop municipal issuers, effectively creating an additional risk-free counterparty. Almost immediately thereafter liquidity resumed and volatility fell as investors were reassured.
  3. Less time for market volatility and black swan events to affect the execution of trades. Shorter settlement times reduce the likelihood of a repeat of the “short squeeze” of January 2021 which caused a rise in meme stocks of broken companies like Gamestop. While there is no quick fix for social media hype and rampant option speculation, relieving some of the forced buying by market makers will make these types of pump-and-dump strategies less profitable than they have been in the past.

Capital Markets

Major U.S. indices closed higher in May, following a weak April. The S&P 500 and Nasdaq saw five consecutive weeks of gains before declining during the last week of the month. In May, the All-Country World Index (ACWI) rose 4.3%, the S&P 500 rose 4.8%, the EAFE rose 4.1%. and U.S. small caps rose 4.9%. Emerging market lagged, rising just 0.61% as slowing growth in China led stocks lower.

May Economic Update: Fed Stays the Course and How Politics Influence Perception of the Economy

The May 1st Fed meeting concluded with no change to the policy rate, which remains at 5.25-5.5%. Prior to the meeting, there was some concern the Fed might shift its stance after recent data suggested inflation ticked up slightly and Fed Governor Bowman indicated higher rates were a possibility.

However, Powell made a point of saying that he doesn’t believe the next policy rate move will be a hike and that he expects the Fed to gain confidence in a cut based on expectations of further disinflation and a more balanced labor market. The net result was a continuation of the Fed’s “watch and wait” posture.

How Political Leanings Skew Perception of the Economy

As we have noted in other recent Monthly Economic Updates, investors often perceive the health of the economy based on political affiliation. The onslaught of disinformation, AI-generated content, and click-bait skews people’s biases even further.

As shown in the chart below, a recent update of a survey by Pew Research Center confirms that Republicans tend to view the economy more favorably when a Republican is in the White House, and likewise for Democrats when the situation is reversed.

Although the average annual returns on the S&P 500 during the Obama administration (+16.3%) and during the Trump administration (+16.0%) were nearly indistinguishable and exceeded the average return over the past three decades, perception of leadership drove sentiment more than actual economic results or stock market performance.


Eagle-eyed readers will also note that perception of economic conditions often changed immediately following election day or soon after, rather than after a President’s policies actually had any influence over the economy.

Is Consumer Sentiment a reliable Predictor of Market Returns?

Famed investor John Templeton once quipped: “Bull markets are born in pessimism, grow on skepticism, mature on optimism and die on euphoria. The time of maximum pessimism is the best time to buy, and the time of maximum optimism is the best time to sell.”

As the chart below shows, over the last 60 years, the 12 months that followed a pessimistic period when consumer sentiment was low were often followed by outsized returns in the S&P 500 (+24.1% on average). By contrast, the twelve months that followed consumer sentiment peaks saw much lower returns (+3.5% on average).


The troughs in sentiment had only a modest correlation with periods of actual economic weakness, with only 4 of the troughs occurring during recessions. Likewise, sentiment was often quite high shortly before a recession was about to begin.

This inconsistency is yet another reminder that how one feels when watching the news is not a predictor of future returns. Regardless of how chaotic geopolitical events are here and abroad, staying invested and separating your feelings from your investment strategy is a prudent approach to building wealth.

Capital Markets

The S&P 500 closed at a new record high of 5,254 at the end of March before momentum reversed resulting in the major indices giving back some of the earlier Q1 gains. During April, the All-Country World Index (ACWI) declined -3.53%, the S&P 500 fell -4.51%, the EAFE fell -2.59%. and U.S. small caps forfeited all their 2024 gains in a -7.4% drop. Emerging market equities were the only area of strength, rising +0.48% for the month.

April Economic Update: Grounding Expectations in Reality

“The secret to happiness is having low expectations.” – Warren Buffett

We have written numerous times in the last six months about the disconnect between investor expectations of Fed rate cuts and the Fed’s own projections. In Q4 2023 when the Fed made clear they were holding off on further rate hikes and were expecting two cuts in 2024, investor expectations were for at least four. Earlier this year, when the Fed adjusted their projections to three possible cuts, investor expectations climbed further to a starry-eyed seven cuts.

February and March saw a reversal of these overly optimistic hopes, which was a welcome change.

Fed Chair Powell finally brought the message home to investors with an appearance on 60 Minutes in February, echoing the same talking points he and the Fed governors have shared for months. Two economic reports in February supported the Fed’s decision to delay: a hot January CPI report and higher than expected forecasted growth in nonfarm payrolls. In January, a steeper than expected decline in retail sales suggested that the Fed’s approach is working, albeit slowly. Last week, the San Francisco Fed updated the central bank’s favorite inflation gauge, the Personal Consumption Expenditures price index (PCE). The index rose 2.5% last month on an annual basis, still well above the Fed’s 2% target. Powell noted that this was “pretty much in line with our expectations” and cautioned investors again that the Fed is not in a rush to cut rates: “If we reduce rates too soon, there’s a chance that inflation would pop back and we’d have to come back in and that would be very disruptive.”

The message seems to be getting through. Investor expectations for the first rate cut shifted from March to June. In addition, the number of cuts expected is now in line with the Fed’s projections.

This removes a potential distraction for investors, who should accept two undeniable truths:

  • Forecasting the time it will take to curb inflation is an exercise in futility.
  • Progress will be made at a sluggish pace.

While we cannot predict when the Fed will cut rates, we can look at how the market has reacted after past rate hike cycles ended.

The chart below shows S&P 500 returns for the 12 months before and 24 months after the end of a rate hike cycle. The 12-month periods leading up to a final hike tend to have negative returns, while the periods following the final hike tend to fare much better. Our current hiking cycle is marked in red, and the hope is that we continue to see a return pattern similar to the 1994-95, 1983-84, and 1988-89 cycles.

Most importantly, historically, for long-term investors: S&P 500 returns for periods 3+ years following a final hike were healthy, with only the 1999-2000 hiking cycle showing negative returns 3 years out.


Capital Markets

In March, most major equity indices finished higher. The All-Country World Index (ACWI) was up +3.4%, the S&P 500 rose +3.4%, the EAFE gained +3.5% and Emerging market equities rose +2.5%. U.S. Small caps had another strong month, finishing up +4.2%. Bonds rose slightly by 0.76%. Treasuries were virtually unchanged for the month, with the 2-year yield at 4.6% and the 10-year yield at 4.2%.


March Economic Update: Don’t Mix Politics and Investing

As we approach Election Day, investors are increasingly nervous about the outcome of the November Presidential election.  Political anxiety is high and rising as the country seems more divided than ever.

Fortunately, we have a long history of stock market returns which includes either government control by one political party or a divided government.  The below chart shows S&P 500 Index returns by calendar year dating back to the 1940s:

The main takeaway is that shifts in power between Republicans and Democrats show little effect on investment results. Market returns have been healthy during Republican (+12.9%), Democrat (+9.3%) and divided governments (+8.3%).  These positive outcomes are an important reminder that staying invested regardless of the outcome of elections is the wisest investment strategy. We understand that political angst is a concern, but we emphasize that the U.S. economy and stock market are driven by market fundamentals which so far this year are supportive of continued growth.

Capital Markets

In February, most major equity indices finished higher. The All-Country World Index (ACWI) was up +4.3%, the S&P 500 grew +5.3%, the EAFE gained +1.8% and Emerging market equities rose +4.8%. U.S. Small caps rebounded after a rough January, finishing up +5.7%. Bonds yields rose, pushing down returns for U.S. Bond Aggregate which fell -1.4%. Treasuries yields moved higher across the curve, with the 2-year yield reaching 4.57% and the 10-year yield at 4.19%.

January Economic Update: We’re not there yet, Goldilocks…

January reports on the labor markets and GDP continue to support our thesis that a “soft landing” is the most probable scenario. However, investors are impatient for the Fed to begin rate cuts and thus were again disappointed by recent strong economic data.

As we highlighted last month, we expect continued volatility around Fed rate expectations. Prior to the Fed meeting, investors expected a March rate cut. This dream was squashed by comments from Fed Chair Powell and Fed Governor Waller, who reiterated there was no reason to move quickly or cut rates meaningfully in March. While acknowledging the past six months of favorable inflation trends, Powell emphasized the necessity for additional data. Following Powell’s comments, market expectations shifted from the high chance of a rate cut in March, to a high chance that rates will remain unchanged. This allowed the Fed to leave their options open.

While the January FOMC meeting didn’t provide a clear signal on timing, all signs point to a Fed more likely to ease monetary policy in the coming months as we are seeing a mix of Hot numbers that need to fall and Cold numbers that need to rise.

What’s “Too Hot”?
Headline CPI above the Fed’s 2-2.2% target.
Q4 GDP increasing 3.3% annual rate exceeding expectations.
Housing costs remain elevated and will take time to come down. In the interim, they provide a hard floor that keeps inflation from falling as rapidly as the Fed wants.
Investor expectations for the Fed to cut rates quickly.

What’s “Too Cold”?
Unemployment consistently trending below 4%, which suggests there remains too much potential for wage-based inflation pressure for the Fed to relax.

What’s “Just Right”?
December Retail Sales were strong, which supports the case that the economy can sustain the current interest rate environment for a period.
Delinquencies in mortgages remain at pre-pandemic levels.

Taken together, it appears that the Fed will cut rates, but we are not there yet.

It’s an election year! Is that Good News or Bad News for stocks?

Since 1928, stocks have performed slightly better in non-election years (+8.0%) than election years (+7.5%)1. While returns have not been markedly different, election years tend to have noticeably higher levels of volatility and intra-year drawdowns. Since 1980, the average election year had a peak-to-trough drawdown of 17% compared to a 13% drawdown in non-election years2. Thus, we should expect the market’s road to the White House to be lined with potholes, speed bumps, and detours. However, investors have historically benefited from staying the course.

1 & 2 Source: J.P. Morgan, 3 election year myths debunked, 1/19/24

Capital Markets

In January, the All-Country World Index (ACWI) was up 0.61%, the S&P 500 was up 1.68% and the EAFE was up 0.59%. Emerging market equities, lead lower by China, fell -4.64%. U.S. Small caps also pulled back, falling -3.89%, after rallying greater than 20% from November to December. Bonds were nearly flat, declining slightly by -0.27% for the month.

Treasuries yields moved slightly higher across the curve, with the 2-year yield reaching 4.46% and the 10-year yield at 4.16%.

The December Rally – Powell Spikes the Eggnog

Driven by expectations of a soft economic landing and potential Federal Reserve interest rate cuts, U.S. stocks rose 4.5% in December, extending the momentum that began in November.   The S&P 500 closed the year with nine consecutive weekly gains, the longest streak since 2004, finishing the month just 0.6% below its January 2022 record close. The small-cap Russell 2000 also had its best month since November 2020, gaining 12.2%. The so-called “Magnificent Seven” stocks trailed as December witnessed a rally in speculative investments, including a strong performance for junk bonds.

The December rally was fostered by the FOMC meeting when the Fed confirmed a shift toward rate cuts in 2024. In the updated Summary of Economic Projections, a.k.a. the Fed’s “Dot Plot”, the forecast for the median Fed funds rate is in the range of 4.5-4.75% by the end of 2024, down from a projection of 5.0-5.25% in September. This pivot sets the Fed’s expectations at three rate cuts in the upcoming year.

This shift in stance encouraged investors to increase their own rate cut expectations, which were already overly optimistic. Surveys show investors expect double the number of rate cuts that the Fed is projecting. While rate cuts are generally good for investors, a wide disconnect between investor expectations and economic reality reflects an environment where markets are likely to experience bouts of volatility.

Economic data for December supported the soft-landing narrative with disinflation gaining traction. Despite some positive economic indicators such as November payrolls beating expectations, there were revisions to the previous two months, and average hourly earnings gains slowed.  The JOLTS report showed job openings fell for the third straight month to the lowest level since March 2021, reflecting a cooling but persistently strong labor market.

However, despite the rally in the past two months, we believe investors should have grounded expectations. We are optimistic, but some patience is warranted given that markets may have fully priced in the most optimistic Fed rate cut scenarios, posing short-term downside risks if the Fed does not meet these expectations.

Capital Markets

The All-Country World Index (ACWI) was up 22.81% for the year, the S&P 500 was up 26.26% and the EAFE up 18.95%. Emerging market equities and U.S. Small caps lagged but were up 10.12% and 16.88% for the year, respectively.

Treasuries saw a rally across the yield curve, with the 2-year yield dropping by nearly 0.45% to 4.25%, the lowest since May. The 10-year yield also decreased by almost 0.50% to just above 3.85%, the lowest since July. 6-month Treasury Bill yields declined slightly to 5.26%.