May delivered strong headline results against a market backdrop defined by competing forces. Corporate earnings accelerated to their best pace since late 2021, supported by technology and ongoing AI infrastructure spending, while mega-cap leadership continued to lift the cap-weighted S&P 500. At the same time, narrow market breadth, persistent inflation, energy price uncertainty, and a Federal Reserve leadership transition created a wider range of possible outcomes for markets.
Strong Earnings and the Rally That Left Half the Market Behind
The first-quarter earnings season closed May in remarkable fashion. After nearly all S&P 500 companies reported, the blended year-over-year earnings growth rate reached 28.6%, the highest since the fourth quarter of 2021.1 Some 85% of companies beat consensus estimates, a rate above the five-year and ten-year averages, and the magnitude of surprise, 16.7% above estimates, was the widest since early 2021.1 The technology sector led all sectors with blended growth of 54.3%, lifted by results from Nvidia, Microsoft, and Dell Technologies. Nvidia alone reported first-quarter revenue of $81.6 billion, an 85% year-over-year increase, and GAAP net income of $58.3 billion, with data center revenue up 92% to a record $75.2 billion.2 The first quarter was, by most traditional measures, one of the strongest in recent memory.
- AI capex: The Nvidia result crystallized a theme running through every major technology earnings call this season: hyperscaler capital spending has not paused. Meta’s increase to full-year 2026 capital expenditure guidance reinforced a broader trend: hyperscalers continue to spend aggressively on AI infrastructure, with aggregate 2026 capex now estimated near $725 billion. 2 Nvidia CEO Jensen Huang described demand as having “gone parabolic” as agentic AI applications accelerated orders from cloud and sovereign customers alike.
- The breadth problem: Behind the record index closes, the rally remained narrow through most of May. The S&P 500 reached new highs due to the mega-caps driving gains, while the average stock in the same index, as measured by the equal-weight S&P 500, produced only modest gains. The top ten holdings by weight currently account for roughly 40% of the S&P 500’s total index value, compared to a historical norm of 20 to 25%.3
- Historical context: The current dominance of the cap-weighted S&P 500 over its equal-weight counterpart has a clear historical precedent: the late-1990s tech bubble when the cap-weighted index outperformed the equal-weighted index by roughly 31% on a 3-year rolling basis.3 More recently, in 2021 the Magnificent Seven gained more than 50% while the broader S&P 500 returned approximately 29%. However, these periods of concentration can reverse quickly: in 2022 the equal-weight index outperformed the Mag 7 by 34 percentage points when the market declined by 18%.3
- Valuation and guidance: The forward 12-month price-to-earnings ratio for the S&P 500 stands at 21.2, above recent historical averages.1 For the second quarter, roughly equal numbers of S&P 500 companies issued positive and negative EPS guidance, a ratio that is worth monitoring as the back half of 2026 approaches. The market’s reaction to Nvidia’s May earnings release highlights the valuation tension embedded in today’s AI leadership. Despite reporting 85% year-over-year revenue growth, shares fell about 2% the following day. This was perceived as a “sell the news” response to a quarter that beat on every metric, because elevated expectations had raised the bar for what constitutes outperformance.2
Implications for Investors: The earnings picture appears to support stock valuations as the AI infrastructure cycle shows little sign of peaking. The concern is not the cycle itself but the distribution of its rewards. When 40% of the S&P 500’s weight sits in ten names, a stumble in any one of them has a greater impact than it would in a more balanced market. Investors who hold broad index exposure also hold a concentrated bet on continued mega-cap outperformance. The gap between cap-weight and equal-weight returns, now widened for several years running, historically closes, and the closure is rarely gradual. Maintaining exposure to companies outside the leading cluster, whether through non-U.S. large cap funds, sector tilts, or individual positions, may provide some insulation when leadership eventually changes.
A New Fed Chair, Inflation Update, and a Shifting Yield Curve
May delivered three macro events that each on their own would have been remarkable for a given month: the highest CPI reading in three years, the confirmation of a new Federal Reserve chair, and a sharp decline in oil prices.
- Inflation: On May 12th, the Bureau of Labor Statistics reported that the Consumer Price Index rose 0.6% in April on a seasonally adjusted basis, putting the 12-month rate at 3.8%, the highest since May 2023. Energy accounted for more than 40% of the monthly increase, with gasoline up 28.4% year-over-year and the broader energy index up 17.9%.4 Core inflation, excluding food and energy, rose 0.4% for the month and 2.8% over the year, well above the Federal Reserve’s 2% target.4 Real average hourly wages slipped 0.5% for the month.4
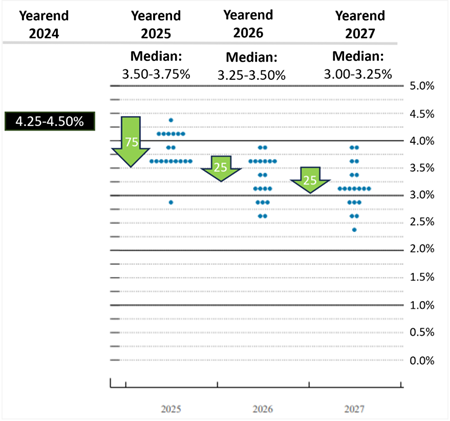
- The new Fed Chair: The Senate confirmed Kevin Warsh as Federal Reserve Chair in a 54-to-45 vote, the slimmest confirmation margin in the modern Fed era.5 Warsh took office May 15th as Jerome Powell’s term as chair expired. The transition comes at an awkward moment: the April FOMC meeting produced four dissents, the most divided committee since 1992, and the funds rate has been held at 3.50% to 3.75% for three consecutive meetings.5 Futures markets have shifted meaningfully: expectations of rate cuts have been priced out and traders have shifted to speculating about a potential rate hike this year.5
- Labor market: April payrolls rose 115,000, well above the 55,000 consensus, and the unemployment rate held at 4.3%, marking back-to-back monthly job gains for the first time in more than a year.6 Average hourly earnings rose 3.6% year-over-year, below the 3.8% forecast, a mild positive for the inflation picture.6
- Oil: Brent crude fell nearly 19% in May as ceasefire extension talks between the U.S. and Iran progressed toward a 60-day memorandum of understanding.7 The WTI oil benchmark fell approximately 16.5% for the month. The decline was welcome, but the situation remains perilous as the Strait of Hormuz remained under restricted conditions pending formal approval of the ceasefire extension.7 The decline in oil prices is likely to benefit near-term CPI readings, but the underlying supply picture remains fragile.
- Yield curve: The Treasury curve flattened meaningfully in May as markets repriced the Fed’s path. The 2-year yield rose sharply on hike expectations, finishing the month near 4.12%, while the 10-year finished the month at approximately 4.45%, having spiked toward 4.7% mid-month on the CPI announcement before retreating as oil prices fell. The 30-year reached 5.18%, its highest level since 2023, before retreating to finish at 5%.8 The spread between 2-year and 10-year Treasury yields narrowed to roughly 0.33%, well below the 1-1.5% range typical of a healthy expansion, as the front end absorbed the inflation shock faster than the long end.8
Implications for Investors: Core inflation is running nearly a full percentage point above the Fed’s target, and the new chair must establish credibility in his first meeting while managing a divided committee. The bond market appears to be pricing not just near-term inflation worries, but also longer-run uncertainty about the fiscal outlook and the Fed’s policy direction. Even after May’s decline, energy prices remain well above year-ago levels, sustaining upward pressure on inflation and weighing on consumer purchasing power. For equity investors, the macroeconomic picture reinforces the case for companies with pricing power, low refinancing risk, and durable free cash flow, characteristics that hold up across a wider range of rate outcomes than the market has seen in recent years.
The Takeaway
If May had a single lesson, it was that strong aggregate numbers can coexist with significant underlying fragility. Earnings were broadly excellent, yet the market rewarded a fraction of the companies generating them. Inflation persisted at the headline level as oil fell, core prices remained stubborn, and the yield curve flattened in ways that suggest the bond market is not yet convinced the problem is solved. A new Fed chair stepped into one of the most divided committees in a generation. Each of these stories has a constructive resolution available to it. What remains unclear is whether they arrive in the sequence that markets have priced in. Investors willing to stay the course while keeping quality and diversification at the center of their portfolios are, in our view, well positioned for what the second half may bring.
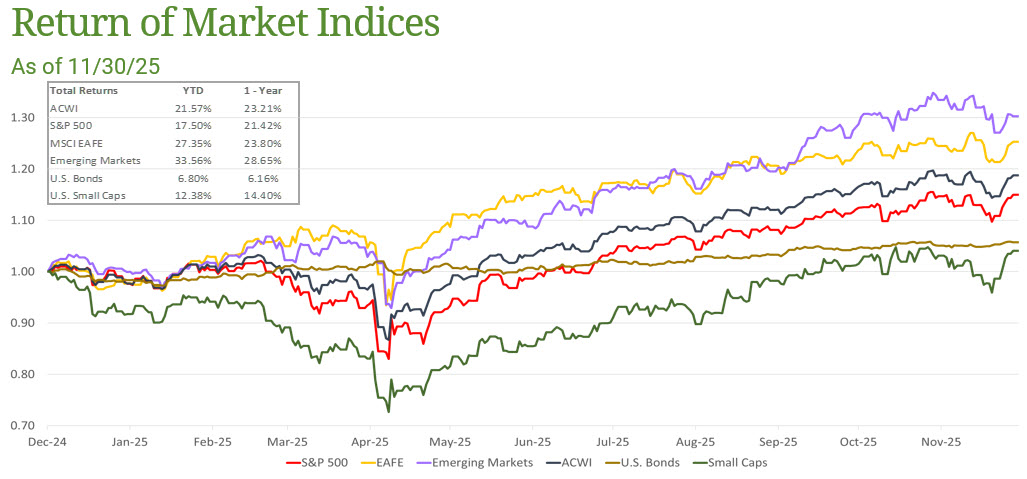
Returns of Market Indices
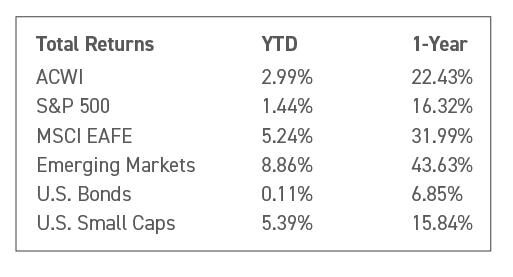
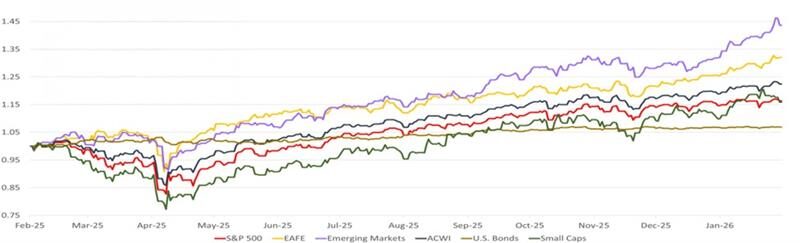
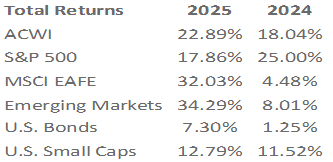
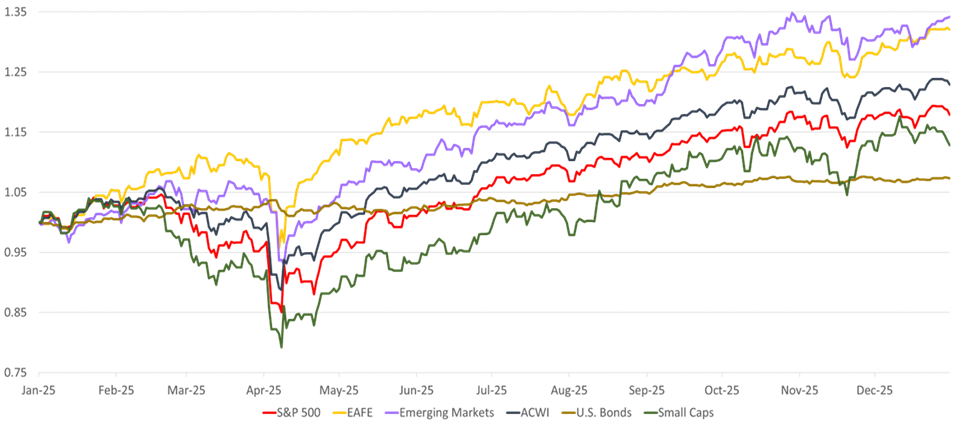
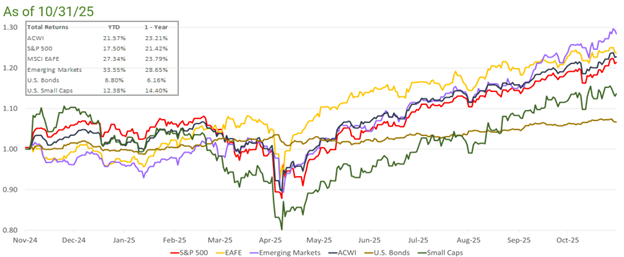
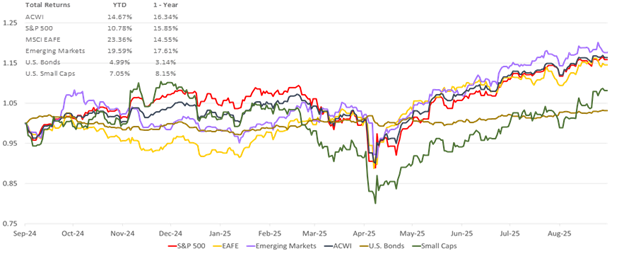
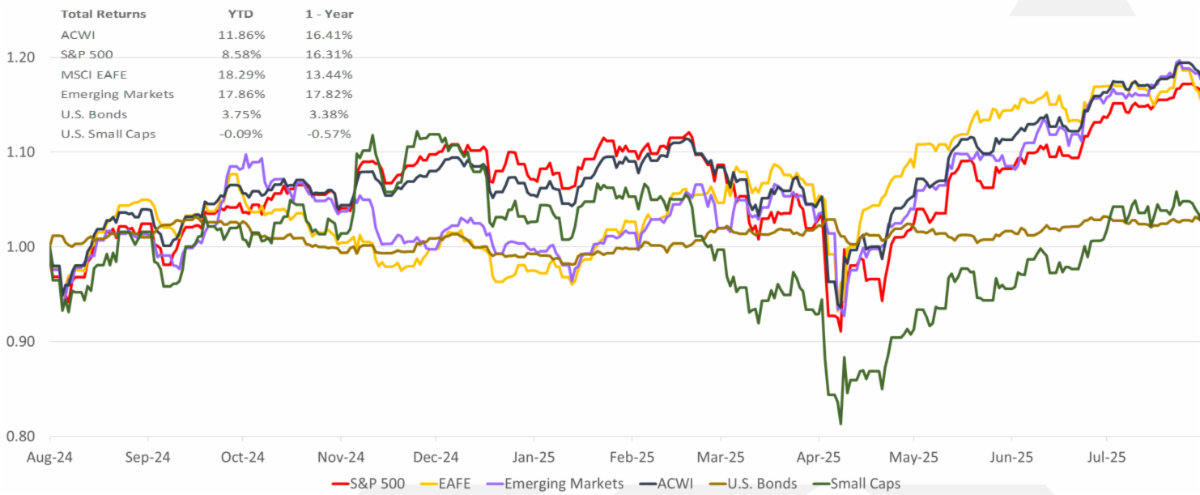
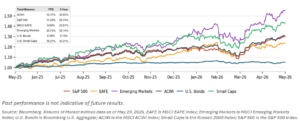
U.S. equities finished May at record levels, with the S&P 500 closing at 7,580, the Dow Jones Industrial Average at 51,032, and the Nasdaq Composite at 26,973, each at an all-time closing high.9 The S&P 500 posted a return of 5.26%, driven by the late-month AI and technology rally following the Nvidia earnings report. Global equity returns were also strong (MSCI ACWI +5.2%). Emerging markets equities, which are particularly sensitive to oil prices, rose dramatically (MSCI EM Equities +9.7%). International developed-market equities, as measured by the MSCI EAFE Index, underperformed U.S. large caps for the month (+3.2% return).9 U.S. small caps rose as well (Russell 2000 +4.4%). Fixed income was under pressure: the 10-year Treasury yield ended May near 4.45% after spiking toward 4.7% mid-month on the CPI results, and the 30-year Treasury reached 5.18% at its mid-month peak, pressuring the Bloomberg U.S. Aggregate Bond Index for the month, which finished nearly flat (+0.31%).9 YTD Returns are shown in the chart below.
Sources
-
FactSet Research Systems, “Earnings Insight,” May 29, 2026 (insight.factset.com). Blended Q1 2026 S&P 500 earnings growth rate of 28.6%; 85% of companies beating estimates; aggregate EPS surprise of 16.7%; forward 12-month P/E of 21.2; Information Technology blended growth of 54.3%; 56 companies issuing positive and 46 negative Q2 2026 EPS guidance.
-
Nvidia Corporation, Q1 FY2027 Earnings Release, May 20, 2026 (nvidianews.nvidia.com). Revenue of $81.6 billion (85% YoY); data center revenue of $75.2 billion (92% YoY); GAAP net income of $58.3 billion (211% YoY); non-GAAP diluted EPS of $1.87. Hyperscaler 2026 capex estimate of approximately $725 billion per CNBC, “Hyperscalers’ AI buildout will require massive amounts of energy,” May 13, 2026 (cnbc.com).
-
S&P Dow Jones Indices, Equal Weight Sector Dashboard, May 2026 (spglobal.com). Top-10 weight at approximately 40% of S&P 500; historical norm 20-25%; dot-com era rolling outperformance figure of ~31%. Magnificent Seven 2021–2022 relative return data per Bloomberg.
-
U.S. Bureau of Labor Statistics, “Consumer Price Index — April 2026,” released May 12, 2026 (bls.gov/news.release/archives/cpi_05122026.htm). CPI +0.6% MoM, +3.8% YoY; core CPI +0.4% MoM, +2.8% YoY; energy index +17.9% YoY; gasoline index +28.4% YoY; real average hourly earnings -0.5% MoM.
-
U.S. Senate Roll Call, May 13, 2026: Kevin Warsh confirmed as Federal Reserve Chair, 54-45 vote. Federal Reserve, FOMC Statement, April 29, 2026; four dissents noted. CNBC, “Kevin Warsh wins Senate confirmation as the next Federal Reserve chair,” May 13, 2026 (cnbc.com). CME FedWatch, May 2026: market-implied probability of a rate hike by December 2026. Federal funds rate target range: 3.50%-3.75%.
-
U.S. Bureau of Labor Statistics, “Employment Situation — April 2026,” released May 8, 2026 (bls.gov/news.release/empsit.nr0.htm). Nonfarm payrolls +115,000; unemployment 4.3%; average hourly earnings +3.6% YoY.
-
CNBC, “Oil drops 20% from 2026 peak on optimism over U.S.-Iran ceasefire talks,” May 29, 2026 (cnbc.com). Brent crude down ~19% for May; WTI down ~16.5%. Pending 60-day MOU between U.S. and Iran to extend ceasefire, per CNBC reporting, May 28, 2026.
-
Federal Reserve H.15 Selected Interest Rates, daily release, May 29, 2026 (federalreserve.gov/releases/h15); data sourced via FRED series DGS2, DGS10, DGS30 (Federal Reserve Bank of St. Louis, fred.stlouisfed.org). Treasury constant maturity yields at month-end: 2-year ~4.12%, 10-year ~4.45%; 30-year mid-month peak ~5.18%, finishing near 5.0%. 2s10s spread (FRED series T10Y2Y) approximately 33 basis points at month-end, vs. 100-150 bp range typical of a healthy expansion. Yield curve flattening driven by front-end repricing on revised Fed expectations; rise in long-end yields attributed to term premium rebuilding.
-
Bloomberg, index closing levels, May 29, 2026. S&P 500: 7,580.06; Dow Jones Industrial Average: 51,032.46; Nasdaq Composite: 26,972.62. 10-year Treasury yield: approximately 4.45% at month-end; 30-year Treasury yield peak of approximately 5.18% mid-month. MSCI EAFE, MSCI ACWI, MSCI Emerging Markets, Russell 2000, and Bloomberg U.S. Aggregate Bond Index returns: Bloomberg terminal, May 2026.