January reports on the labor markets and GDP continue to support our thesis that a “soft landing” is the most probable scenario. However, investors are impatient for the Fed to begin rate cuts and thus were again disappointed by recent strong economic data.
As we highlighted last month, we expect continued volatility around Fed rate expectations. Prior to the Fed meeting, investors expected a March rate cut. This dream was squashed by comments from Fed Chair Powell and Fed Governor Waller, who reiterated there was no reason to move quickly or cut rates meaningfully in March. While acknowledging the past six months of favorable inflation trends, Powell emphasized the necessity for additional data. Following Powell’s comments, market expectations shifted from the high chance of a rate cut in March, to a high chance that rates will remain unchanged. This allowed the Fed to leave their options open.
While the January FOMC meeting didn’t provide a clear signal on timing, all signs point to a Fed more likely to ease monetary policy in the coming months as we are seeing a mix of Hot numbers that need to fall and Cold numbers that need to rise.
What’s “Too Hot”?
• Headline CPI above the Fed’s 2-2.2% target.
• Q4 GDP increasing 3.3% annual rate exceeding expectations.
• Housing costs remain elevated and will take time to come down. In the interim, they provide a hard floor that keeps inflation from falling as rapidly as the Fed wants.
• Investor expectations for the Fed to cut rates quickly.
What’s “Too Cold”?
• Unemployment consistently trending below 4%, which suggests there remains too much potential for wage-based inflation pressure for the Fed to relax.
What’s “Just Right”?
• December Retail Sales were strong, which supports the case that the economy can sustain the current interest rate environment for a period.
• Delinquencies in mortgages remain at pre-pandemic levels.
Taken together, it appears that the Fed will cut rates, but we are not there yet.
It’s an election year! Is that Good News or Bad News for stocks?
Since 1928, stocks have performed slightly better in non-election years (+8.0%) than election years (+7.5%)1. While returns have not been markedly different, election years tend to have noticeably higher levels of volatility and intra-year drawdowns. Since 1980, the average election year had a peak-to-trough drawdown of 17% compared to a 13% drawdown in non-election years2. Thus, we should expect the market’s road to the White House to be lined with potholes, speed bumps, and detours. However, investors have historically benefited from staying the course.
1 & 2 Source: J.P. Morgan, 3 election year myths debunked, 1/19/24
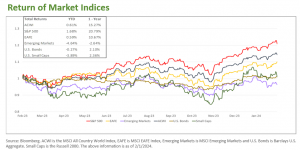
Capital Markets
In January, the All-Country World Index (ACWI) was up 0.61%, the S&P 500 was up 1.68% and the EAFE was up 0.59%. Emerging market equities, lead lower by China, fell -4.64%. U.S. Small caps also pulled back, falling -3.89%, after rallying greater than 20% from November to December. Bonds were nearly flat, declining slightly by -0.27% for the month.
Treasuries yields moved slightly higher across the curve, with the 2-year yield reaching 4.46% and the 10-year yield at 4.16%.