The recent passage of the One Big Beautiful Act or OBBBA (also known as HR 1) by the U.S. House of Representatives could have implications for the budget deficit in its current form, and in turn for domestic and international bond markets and the economy.
Although there will no doubt be significant changes to the House version of the bill before it passes, a major impact on taxes would be the extension of many provisions of the 2017 Tax Cuts and Jobs Act and substantial additional spending on defense and border security.
The current administration believes the current bill will generate economic growth, lead to lower deficits, and put the country on a more fiscally sustainable path.
Reactions in the Bond Market
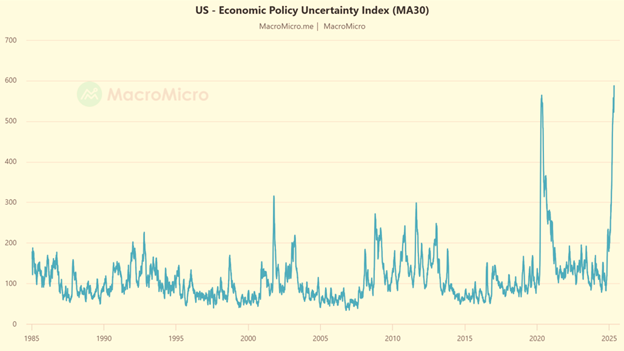
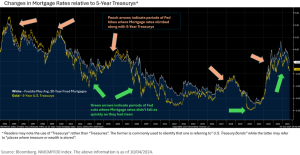
However, not everyone agrees the current bill will achieve these goals. The bond market’s reaction has been a decline in bond prices leading to an increase in yields. Notably, the 10-year Treasury yield has climbed to around 4.5% (from 4% earlier in the year), while the 30-year bond yield has risen to 5%, well above the 4.75% long term average. While many factors affect trends in bond yields, this year bond markets have been skittish about the effects of increased tariffs and inflation fears. The Federal government’s unwillingness to address deficit spending have added to the bearish narrative.
With higher interest rates driving up the cost of servicing debt, strong economic growth becomes even more critical to balancing the budget and maintaining fiscal stability.
Today’s Deficit is Manageable
While reducing the deficit is a worthwhile goal, it’s important to recognize that the US’s Federal debt level of 118% debt-to-GDP is not an outlier. Among G7 nations, the average debt-to-GDP ratio stands at around 125%. Notably, Japan’s debt-to-GDP stands at 250% and has been above 100% for over two decades all while maintaining both economic stability and investor confidence.* Although elevated debt can contribute to risks like inflation or slower growth, it does not necessarily signal financial distress—particularly for an economy like the U.S., which continues to serve as the world’s benchmark.
Safe Haven Status
The U.S. can sustain high debt levels and still be a destination for global capital inflows due to a unique combination of structural, institutional and economic strengths. As the issuer of the world’s primary reserve currency, the U.S. benefits from constant demand for its debt, allowing it to borrow at relatively low costs. Its financial markets are the largest, most liquid, and among the most transparent in the world, reinforcing investor confidence. The U.S. economy is also highly innovative and productive, driven by leadership in technology, finance, and consumer sectors.
During times of global uncertainty, the U.S. is viewed as a safe haven, with investors flocking to its assets despite rising debt. Strong institutions like the Federal Reserve and a long-standing reputation for honoring debt further support its credibility. All of these factors make the U.S. an attractive and reliable place to invest, even with a high (and potentially rising) debt-to-GDP ratio.
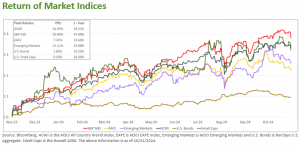
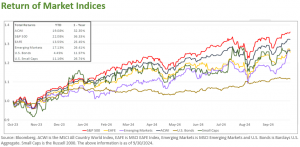
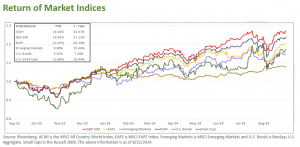
Capital Markets
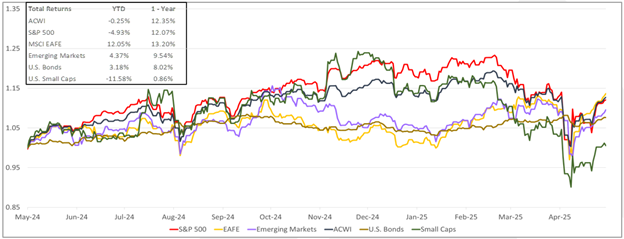
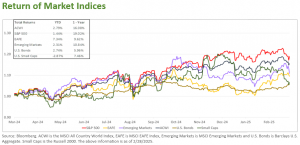
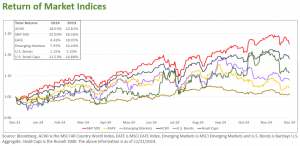
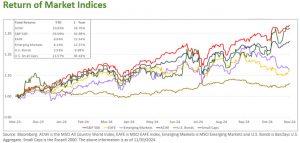
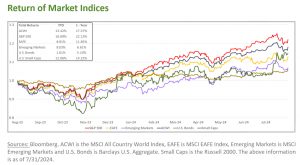
Equities bounced back in May after a turbulent April. The All-Country World Index (ACWI) finishing up 5.7%, led by the US with a gain of 6.3% for the S&P 500. Developed international equities, as measured by the EAFE index, had another strong month, adding 4.7%, to close May up17.3% YTD. Emerging market equities increased by 4.0%. Bond prices declined by .7% as interest rates rose.
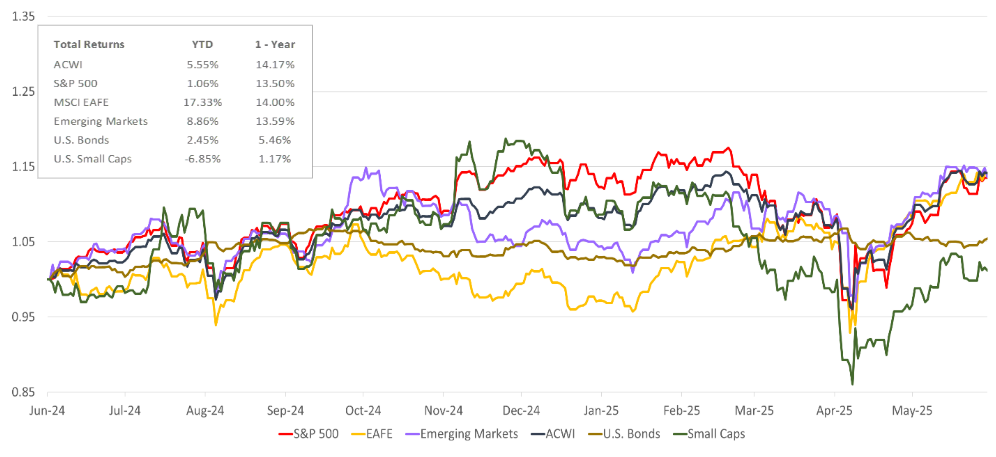
Source: Bloomberg. EAFE is MSCI EAFE Index(1), Emerging Markets is MSCI Emerging Markets(2) and U.S. Bonds is Barclays U.S. Aggregate(3). ACWI is the MSCI ACWI Index(4). Small Caps is the Russell 2000 Index(5). S&P 500 is the S&P 500 Index(6). The above information is as of 5/30/2025. See last page for important information.
We continue to be focused on investing for the long term while remaining sensitive to potential short-term opportunities and risks. We encourage you to reach out to your Crestwood Advisor with any questions or concerns you may have. If you are not yet working with a Crestwood Advisor, we invite you to schedule some time to discuss how Crestwood works with individuals and families like yours to help them achieve their wealth goals.
This document contains forward-looking statements, predictions and forecasts (“forward-looking statements”) concerning our beliefs and opinions in respect of the future. Forward-looking statements necessarily involve risks and uncertainties, and undue reliance should not be placed on them. There can be no assurance that forward-looking statements will prove to be accurate, and actual results and future events could differ materially from those anticipated in such statements.
*International Monetary Fund: https://www.imf.org/external/datamapper/d@FPP/USA/FRA/JPN/GBR/SWE/ESP/ITA/ZAF/ What Lessons Can Be Drawn from Japan’s High Debt-to-GDP Ratio? Federal Reserve Bank of St. Louis, November 14, 2023