April Economic Update: Grounding Expectations in Reality

“The secret to happiness is having low expectations.” – Warren Buffett

We have written numerous times in the last six months about the disconnect between investor expectations of Fed rate cuts and the Fed’s own projections. In Q4 2023 when the Fed made clear they were holding off on further rate hikes and were expecting two cuts in 2024, investor expectations were for at least four. Earlier this year, when the Fed adjusted their projections to three possible cuts, investor expectations climbed further to a starry-eyed seven cuts.

February and March saw a reversal of these overly optimistic hopes, which was a welcome change.

Fed Chair Powell finally brought the message home to investors with an appearance on 60 Minutes in February, echoing the same talking points he and the Fed governors have shared for months. Two economic reports in February supported the Fed’s decision to delay: a hot January CPI report and higher than expected forecasted growth in nonfarm payrolls. In January, a steeper than expected decline in retail sales suggested that the Fed’s approach is working, albeit slowly. Last week, the San Francisco Fed updated the central bank’s favorite inflation gauge, the Personal Consumption Expenditures price index (PCE). The index rose 2.5% last month on an annual basis, still well above the Fed’s 2% target. Powell noted that this was “pretty much in line with our expectations” and cautioned investors again that the Fed is not in a rush to cut rates: “If we reduce rates too soon, there’s a chance that inflation would pop back and we’d have to come back in and that would be very disruptive.”

The message seems to be getting through. Investor expectations for the first rate cut shifted from March to June. In addition, the number of cuts expected is now in line with the Fed’s projections.

This removes a potential distraction for investors, who should accept two undeniable truths:

  • Forecasting the time it will take to curb inflation is an exercise in futility.
  • Progress will be made at a sluggish pace.

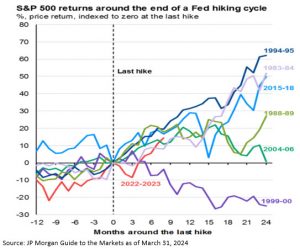
While we cannot predict when the Fed will cut rates, we can look at how the market has reacted after past rate hike cycles ended.

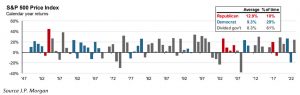
The chart below shows S&P 500 returns for the 12 months before and 24 months after the end of a rate hike cycle. The 12-month periods leading up to a final hike tend to have negative returns, while the periods following the final hike tend to fare much better. Our current hiking cycle is marked in red, and the hope is that we continue to see a return pattern similar to the 1994-95, 1983-84, and 1988-89 cycles.

Most importantly, historically, for long-term investors: S&P 500 returns for periods 3+ years following a final hike were healthy, with only the 1999-2000 hiking cycle showing negative returns 3 years out.


Capital Markets

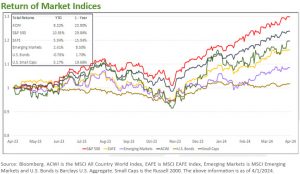
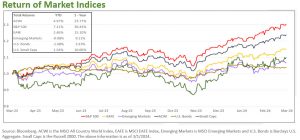
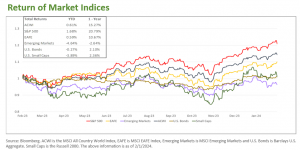
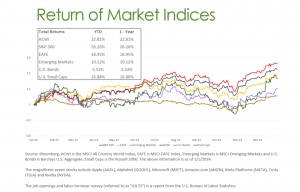
In March, most major equity indices finished higher. The All-Country World Index (ACWI) was up +3.4%, the S&P 500 rose +3.4%, the EAFE gained +3.5% and Emerging market equities rose +2.5%. U.S. Small caps had another strong month, finishing up +4.2%. Bonds rose slightly by 0.76%. Treasuries were virtually unchanged for the month, with the 2-year yield at 4.6% and the 10-year yield at 4.2%.


March Economic Update: Don’t Mix Politics and Investing

As we approach Election Day, investors are increasingly nervous about the outcome of the November Presidential election.  Political anxiety is high and rising as the country seems more divided than ever.

Fortunately, we have a long history of stock market returns which includes either government control by one political party or a divided government.  The below chart shows S&P 500 Index returns by calendar year dating back to the 1940s:

The main takeaway is that shifts in power between Republicans and Democrats show little effect on investment results. Market returns have been healthy during Republican (+12.9%), Democrat (+9.3%) and divided governments (+8.3%).  These positive outcomes are an important reminder that staying invested regardless of the outcome of elections is the wisest investment strategy. We understand that political angst is a concern, but we emphasize that the U.S. economy and stock market are driven by market fundamentals which so far this year are supportive of continued growth.

Capital Markets

In February, most major equity indices finished higher. The All-Country World Index (ACWI) was up +4.3%, the S&P 500 grew +5.3%, the EAFE gained +1.8% and Emerging market equities rose +4.8%. U.S. Small caps rebounded after a rough January, finishing up +5.7%. Bonds yields rose, pushing down returns for U.S. Bond Aggregate which fell -1.4%. Treasuries yields moved higher across the curve, with the 2-year yield reaching 4.57% and the 10-year yield at 4.19%.

January Economic Update: We’re not there yet, Goldilocks…

January reports on the labor markets and GDP continue to support our thesis that a “soft landing” is the most probable scenario. However, investors are impatient for the Fed to begin rate cuts and thus were again disappointed by recent strong economic data.

As we highlighted last month, we expect continued volatility around Fed rate expectations. Prior to the Fed meeting, investors expected a March rate cut. This dream was squashed by comments from Fed Chair Powell and Fed Governor Waller, who reiterated there was no reason to move quickly or cut rates meaningfully in March. While acknowledging the past six months of favorable inflation trends, Powell emphasized the necessity for additional data. Following Powell’s comments, market expectations shifted from the high chance of a rate cut in March, to a high chance that rates will remain unchanged. This allowed the Fed to leave their options open.

While the January FOMC meeting didn’t provide a clear signal on timing, all signs point to a Fed more likely to ease monetary policy in the coming months as we are seeing a mix of Hot numbers that need to fall and Cold numbers that need to rise.

What’s “Too Hot”?
Headline CPI above the Fed’s 2-2.2% target.
Q4 GDP increasing 3.3% annual rate exceeding expectations.
Housing costs remain elevated and will take time to come down. In the interim, they provide a hard floor that keeps inflation from falling as rapidly as the Fed wants.
Investor expectations for the Fed to cut rates quickly.

What’s “Too Cold”?
Unemployment consistently trending below 4%, which suggests there remains too much potential for wage-based inflation pressure for the Fed to relax.

What’s “Just Right”?
December Retail Sales were strong, which supports the case that the economy can sustain the current interest rate environment for a period.
Delinquencies in mortgages remain at pre-pandemic levels.

Taken together, it appears that the Fed will cut rates, but we are not there yet.

It’s an election year! Is that Good News or Bad News for stocks?

Since 1928, stocks have performed slightly better in non-election years (+8.0%) than election years (+7.5%)1. While returns have not been markedly different, election years tend to have noticeably higher levels of volatility and intra-year drawdowns. Since 1980, the average election year had a peak-to-trough drawdown of 17% compared to a 13% drawdown in non-election years2. Thus, we should expect the market’s road to the White House to be lined with potholes, speed bumps, and detours. However, investors have historically benefited from staying the course.

1 & 2 Source: J.P. Morgan, 3 election year myths debunked, 1/19/24

Capital Markets

In January, the All-Country World Index (ACWI) was up 0.61%, the S&P 500 was up 1.68% and the EAFE was up 0.59%. Emerging market equities, lead lower by China, fell -4.64%. U.S. Small caps also pulled back, falling -3.89%, after rallying greater than 20% from November to December. Bonds were nearly flat, declining slightly by -0.27% for the month.

Treasuries yields moved slightly higher across the curve, with the 2-year yield reaching 4.46% and the 10-year yield at 4.16%.

The December Rally – Powell Spikes the Eggnog

Driven by expectations of a soft economic landing and potential Federal Reserve interest rate cuts, U.S. stocks rose 4.5% in December, extending the momentum that began in November.   The S&P 500 closed the year with nine consecutive weekly gains, the longest streak since 2004, finishing the month just 0.6% below its January 2022 record close. The small-cap Russell 2000 also had its best month since November 2020, gaining 12.2%. The so-called “Magnificent Seven” stocks trailed as December witnessed a rally in speculative investments, including a strong performance for junk bonds.

The December rally was fostered by the FOMC meeting when the Fed confirmed a shift toward rate cuts in 2024. In the updated Summary of Economic Projections, a.k.a. the Fed’s “Dot Plot”, the forecast for the median Fed funds rate is in the range of 4.5-4.75% by the end of 2024, down from a projection of 5.0-5.25% in September. This pivot sets the Fed’s expectations at three rate cuts in the upcoming year.

This shift in stance encouraged investors to increase their own rate cut expectations, which were already overly optimistic. Surveys show investors expect double the number of rate cuts that the Fed is projecting. While rate cuts are generally good for investors, a wide disconnect between investor expectations and economic reality reflects an environment where markets are likely to experience bouts of volatility.

Economic data for December supported the soft-landing narrative with disinflation gaining traction. Despite some positive economic indicators such as November payrolls beating expectations, there were revisions to the previous two months, and average hourly earnings gains slowed.  The JOLTS report showed job openings fell for the third straight month to the lowest level since March 2021, reflecting a cooling but persistently strong labor market.

However, despite the rally in the past two months, we believe investors should have grounded expectations. We are optimistic, but some patience is warranted given that markets may have fully priced in the most optimistic Fed rate cut scenarios, posing short-term downside risks if the Fed does not meet these expectations.

Capital Markets

The All-Country World Index (ACWI) was up 22.81% for the year, the S&P 500 was up 26.26% and the EAFE up 18.95%. Emerging market equities and U.S. Small caps lagged but were up 10.12% and 16.88% for the year, respectively.

Treasuries saw a rally across the yield curve, with the 2-year yield dropping by nearly 0.45% to 4.25%, the lowest since May. The 10-year yield also decreased by almost 0.50% to just above 3.85%, the lowest since July. 6-month Treasury Bill yields declined slightly to 5.26%.