
“When you come to a fork in the road, take it.” – Yogi Berra
The term “K-shaped recovery” gained prominence in 2020 during the uneven rebound from the Covid-19 recession. Popularized by economist Peter Atwater, the concept describes how, following an economic downturn, certain economic groups and industry sectors recover rapidly while others stagnate. A K-shaped recovery differs from the more familiar V-shaped recovery (a sharp decline followed by a strong rebound) or U-shaped recovery (a slower return to growth). The K-shape is defined by unequal growth: some “arms” of the economy rise while others continue to fall, creating a pattern that resembles the letter “K.”
In the years since the pandemic, this “K” pattern has persisted, and we currently have a K-shaped economy. Wealth has grown disproportionately among high-income households, large corporations (especially tech and capital-light firms), and asset‐owners, while lower‐income households, small and medium employers, and service-industries reliant on physical presence continue to struggle.
Consumer spending is a primary driver of the U.S. economy and a key indicator of economic growth and illustrates the K-phenomenon. Before the onset of Covid, spending patterns were broadly similar across income groups. However, the chart below illustrates that spending by the highest 20% of earners outpaced that of other groups as we emerged from the pandemic, and the gap continues to widen.
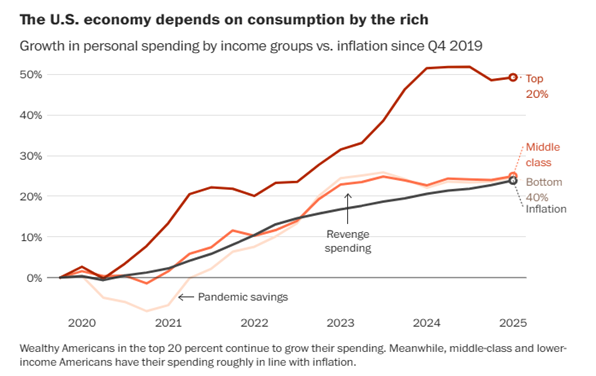
Source: Moody’s
Similarly, a report from October 2024 from the Federal Reserve shows that retail spending of the bottom 80% of Americans, as measured by income, has roughly kept pace with inflation, while the highest 20% of earners have increased their spending by close to 50% in the post-pandemic period!
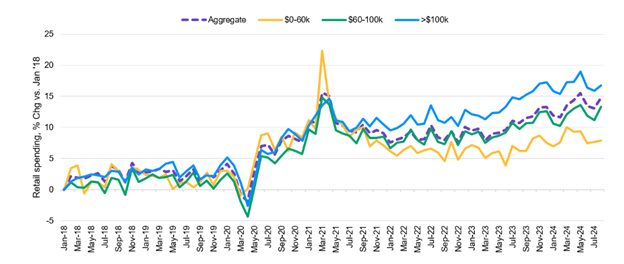
Source: Hacıoğlu Hoke, Sinem, Leo Feler, and Jack Chylak (2024). “A Better Way of Understanding the US Consumer: Decomposing Retail Sales by Household Income,” FEDS Notes. Washington: Board of Governors of the Federal Reserve System, October 11, 2024, https://doi.org/10.17016/2380-7172.3611.
What’s Driving the K-Shaped Economy?
There are four primary factors driving the K-shaped economy that help to explain the widening disparity between winners and losers among both producers and consumers. These include:
- The Impact of Technology
The rapid adoption of artificial intelligence, automation, and digital platforms has accelerated productivity and profitability in key high-tech sectors. Workers and companies equipped to leverage technology are pulling ahead, while those dependent on manual or low-skill labor are being left behind. - Uneven Wage and Employment Growth
The post-pandemic labor market remains divided. High-income professionals in technology, finance, and healthcare enjoy steady job growth and salary increases, while many service-sector and blue-collar workers face stagnant wages or reduced hours. Automation and AI-driven efficiencies have increased productivity while displacing many lower-wage roles. - The Unequal Impact of Inflation and Interest Rates
Inflation and elevated interest rates have widened the gap between economic winners and losers. Wealthier households with greater savings and investment portfolios can absorb higher prices and even benefit from rising interest income. Meanwhile, lower-income families, who spend a higher share of income on essentials like food, energy, and rent, feel the strain. Rising credit card balances and delinquency rates show how unevenly these costs are distributed. - Asset Price Divergence aka “The Wealth Effect”
Financial markets have surged over the past two years. Homeowners and investors have seen their wealth grow as real estate and stock values appreciate. In contrast, renters, and those without substantial assets, have missed out on these wealth effects, widening the financial gap between households.
Implications for Investors
Aggregate metrics like GDP growth, corporate profits and stock market indices reflect activity as a whole rather than how each segment is faring. Overall, the U.S. economy appears healthy. But underneath the surface there is deep inequality, fragility in many out-of-favor sectors, and risks that reflect an asymmetric weakness in the economy.
For investors, the K-shaped economy creates both opportunities and risks, as returns will vary sharply across sectors and industries.
Sector Divergence Reflects “Two Economies”
In 2025, stock market performance mirrors the same K-shaped pattern. Technology stocks related to AI have soared while consumer staples and other sectors lagged.
According to S&P sector data through the end of October:
- The Upper-Arm of the K Leaders: The Technology sector saw a total return of +29.9% and the Communications sector +26.8%, fueled by corporate investment in AI, automation and productivity tools. The Industrial and Utility sectors saw a rise of +18.9% and +20.2%, respectively.
- The Lower-Arm Laggards: By contrast, all other sectors saw single-digit returns: the Financial sector (+9.6%), Consumer Discretionary sector (+7.8%), Healthcare sector (+6.3%), Energy sector (+5.8%), Materials sector (+3.8%), Real Estate sector (nearly flat at +0.2%).
Source: Standard and Poor’s
Rising Inequality Alters Market Dynamics
As wealth becomes more concentrated, stock market participation increasingly reflects the spending and investment behavior of affluent households. Gains in financial markets boost high-income spending, which supports certain sectors, while the rest of the economy remains subdued. For investors, paying close attention to demographic and income-driven consumption trends is more important than ever.
Defensive Positioning for Uneven Growth
In a K-shaped environment, diversification across economic segments becomes crucial. Investors should favor companies with pricing power, strong balance sheets, and exposure to higher-income consumers. Long-time readers will note that the first two criteria are also hallmarks of Quality-focused investing, which we have frequently advocated.
The K-shape is becoming a defining feature of the modern U.S. economy. For investors, understanding this divergence is essential to navigating risk and identifying opportunity as the winners in 2025 likely will continue to be firms that cater to higher-income consumers and those that best leverage technology and maintain pricing power.
Capital Markets
Following on the recent pattern of market rises after each rate cut, once again all boats rose with the tide in October. The All-Country World Equity Index (ACWI) and S&P 500 both rose 2.3%. US Small Cap equities, measured by the Russell 2000, gained 1.8%. International Developed stocks, as measured by the EAFE, increased by 1.2%. Emerging market equities had another strong month, surging 4.2% Not to be left out, US bond prices rose 0.6% for the month.
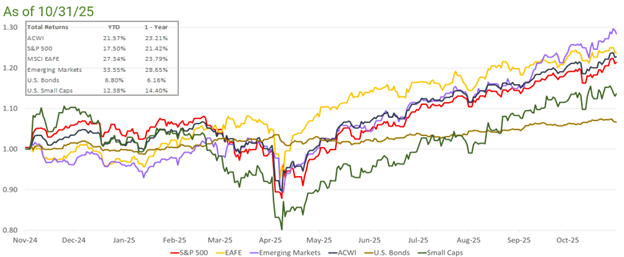
Source: Bloomberg. EAFE is MSCI EAFE Index(1), Emerging Markets is MSCI Emerging Markets(2) and U.S. Bonds is Barclays U.S. Aggregate(3). ACWI is the MSCI ACWI Index(4). Small Caps is the Russell 2000 Index(5). S&P 500 is the S&P 500 Index(6). The above information is as of 10/31/2025.
