April 2026 Economic and Market Update: Geopolitics at the Forefront

The U.S.-Iran conflict escalated in late February, shifting from a geopolitical risk to a real supply disruption. Markets responded with a broad risk-off move across equities and bonds.

The Strait of Hormuz and the Energy Shock

On March 4, Iranian forces declared the Strait of Hormuz closed, restricting tanker traffic through a waterway that carried roughly 20 million barrels of oil per day as of 2024, representing approximately 27% of global maritime petroleum trade.1 The commercial shipping community responded immediately: insurers withdrew coverage and major oil companies halted transits. Brent closed above $100 per barrel on March 12, the first time since August 2022.2 The International Energy Agency characterized the disruption as the largest in the history of the global oil market.3

  • The scope of the selloff: March’s selloff was broad-based, with most sectors declining and only Energy posting a meaningful gain. The S&P 500 returned -4.3% in the first quarter, but index-level results still diverged sharply: the Russell 1000 Growth Index fell 9.8%, while the Russell 1000 Value Index rose 2.1%. That gap was driven largely by index composition, as value benchmarks benefited from their heavier exposure to Energy. However, the dominant impulse across the market overall was macro de-risking, not rotation.4
  • Treasury yields increased: Treasury yields rose sharply throughout the month. The 10-year U.S. Treasury yield closed near 4.43% as of March 27, up materially from its February month-end level of 4.15%, while the 2-year yield rose in parallel as investors pared back expectations for near-term Fed cuts.5
  • The supply architecture: OPEC+ holds approximately 3.5 million barrels per day of spare capacity, concentrated in Saudi Arabia and the UAE, but a significant portion of that capacity cannot reach global markets if the Strait remains inaccessible. Saudi Arabia and the UAE moved quickly to reroute oil via overland pipelines, and the International Energy Agency coordinated an emergency stock release that could approach 3 million barrels per day. These measures provide a partial buffer, characterized as stop-gap solutions rather than structural offsets. Importantly, the strait remains the bottleneck and overland pipeline capacity covers only a fraction of normal volumes.3, 6

Implications for Investors: The near-term inflation impact is real: U.S. gas prices rose approximately $0.60 per gallon in the two weeks following the start of the conflict, and Bloomberg Economics estimated March CPI at 3.4% year-over-year, up from 2.4% in February. The medium-term economic impact depends almost entirely on how long the Strait remains disrupted. Combined with slower job growth and sluggish wage increases, higher energy costs are likely to hurt lower-income consumers. This volatility is a reminder that while geopolitical risk can never be avoided entirely, there are tangible benefits to being diversified across sectors, geographies, and asset classes.

The Fed: Holding Course While the Map Changes

The Federal Open Market Committee met on March 17 and 18 and voted 11 to 1 to hold the federal funds rate unchanged at 3.50% to 3.75%.7 The decision was widely anticipated. What made the meeting notable was what the committee said, not what it did. The FOMC statement explicitly acknowledged that developments in the Middle East create uncertainty for the U.S. economy, a direct insertion of the conflict into the official policy framework. Chair Powell summarized the committee’s posture with characteristic plainness: the Fed simply does not yet know what the economic consequences of the conflict will be.

  • The inflation data (before the shock): February CPI came in at 2.4% year-over-year, matching January’s 2.4% and down from 2.7% in December 2025, and core CPI rose 2.5%. Those readings were constructive. The energy-driven inflation shock that began in early March will not fully appear in official data until April and May releases.10
  • Updated projections: The March Summary of Economic Projections (aka the “Fed’s Dot Plot”) revised inflation projections upward, with the median Personal Consumption Expenditure (PCE) inflation forecast for 2026 increasing 0.3% to 2.7%, the largest single-year upward revision in recent memory. The median projected federal funds rate for year-end 2026 remains at 3.4%, implying one additional 25-basis-point cut over the remainder of the year.7, 8
  • Shifting Expectations: Before the conflict, futures markets were pricing two rate cuts in 2026 with a small probability of a third. By month-end, the consensus had collapsed to at most one cut, with CME FedWatch showing a meaningful probability of no cut at all this year. Seven of 19 FOMC participants indicated in the dot plot that they expect rates to stay unchanged through year-end, one more than in December.7, 9

Implications for Investors: The Fed’s current position is genuinely uncomfortable: headline inflation is heading higher in the near term due to energy prices, growth data is softening, and the committee has limited room to act in either direction without signaling something it does not intend. The Fed tends to watch Core inflation, which excludes often-volatile energy and food prices, because it is a better gauge of persistent price trends. During periods of sharply rising energy prices, like today, the Fed will be watching Core inflation to see if this results in higher costs in other goods and services.

A disruption that resolves quickly would allow the committee to resume its easing path and reassure bond markets. Prolonged disruption risks entrenching elevated inflation expectations. How events unfold from here will depend almost entirely on the timeline of the disruption. In either scenario, portfolio duration and credit quality are the levers most worth watching.

Trends Worth Noting

  • The AI investment cycle has not been disrupted by the selloff: The March drawdown was a macro event, not an AI story, and the distinction matters. AI capex commitments from major technology companies have not reversed and earnings from the tech sector are expected to significantly outpace the rest of the market. The risk is not that AI investment collapses; the risk is that a prolonged energy shock delays the translation of that investment into bottom-line results.11
  • Earnings resilience is holding: Despite the market selloff, the fundamental earnings backdrop has not broken down. S&P 500 companies are expected to report double-digit earnings growth for a sixth consecutive quarter in Q1 2026, with FactSet’s blended estimate at 13.2% year-over-year as of early April. Energy sector earnings revisions have turned sharply positive. The broader question entering the second quarter is whether oil-driven cost pressures and weakening consumer confidence begin to show up in guidance. 11, 13
  • Stagflation concerns are rising: The combination of energy-driven inflation and softening growth data has put the S-word back on investors’ radar. February job openings fell to 6.88 million, with the hires rate dropping to 3.1%. This was the lowest since the early months of the pandemic and may be an indication that the labor market is losing momentum. What distinguishes the current episode from the 1970s analogy, at least for now, is that longer-term inflation expectations remain well anchored, and corporate earnings have not yet deteriorated. If either deteriorates, stagflation could be on the horizon.12


The Takeaway

The Strait of Hormuz crisis triggered a selloff that cut across styles, market capitalizations, and sectors as a sudden repricing of inflation and growth simultaneously overwhelmed the reallocation logic that normally drives market rotation. The Fed is navigating a dual-mandate conflict with limited room to maneuver, earnings have held up but the economic landscape is changing, and the resolution of the energy shock depends on a variable no economic model can forecast. What the Trends and Implications described above share is that they were in motion before March and will outlast it: the stagflation debate, the AI capex cycle, and the argument for geographic diversification are not products of one difficult month. Patience, breadth, and a bias toward quality remain the prudent investment philosophy.


RETURNS OF MARKET INDICES

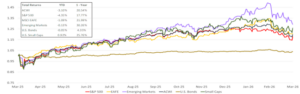
Global equity markets saw large declines in March as a whole (MSCI ACWI -7.1%) led by Emerging Markets (MSCI Emerging Market Equity Index -13%). U.S. large caps (S&P 500) fared better during this period but were still down 5%, in line with U.S. small caps (Russell 2000 -5%). International developed (MSCI EAFE) equities fell 10%. Bonds declined by 1.8% for the month.  YTD returns are shown in the chart below.14

Sources
  1. U.S. Congressional Research Service, “Iran Conflict and the Strait of Hormuz: Impacts on Oil, Gas, and Other Commodities,” R45281, updated March 2026. Approximately 27% of world maritime oil trade transits the Strait; 2024 volumes approximately 20 million barrels per day.
  2. CNBC, “Brent oil closes at $100 after Iran’s new supreme leader says Strait of Hormuz must remain closed,” March 12, 2026; CNBC, “Front-month Brent oil futures extend gains after record monthly rise in March,” April 1, 2026 (citing LSEG data). Brent closed above $100 on March 12; reached an intramonth high before easing; Brent monthly gain approximately 64%, a record per LSEG data dating to 1988. WTI gained approximately 51% in March, best month since May 2020.
  3. International Energy Agency, Oil Market Report, March 2026. Characterized as the largest supply disruption in the history of the global oil market. Global oil supply projected to fall approximately 8 mb/d in March. Brent futures traded within a whisker of $120/bbl at intramonth high.
  4. S&P Global Market Intelligence, “US REIT stocks outperform broader stock market in Q1 2026,” April 2026 (citing S&P Dow Jones Indices data as of March 31, 2026): S&P 500 Q1 2026 total return -4.3%. Russell style and size returns from Confluence Financial Partners, “First Quarter 2026 Market Recap,” April 2026, citing Morningstar and FTSE Russell data as of March 31, 2026: Russell 1000 Growth -9.78%; Russell 1000 Value +2.10%; Russell 2000 +0.89%.
  5. Federal Reserve, H.15 Selected Interest Rates (federalreserve.gov). 10-year Treasury constant maturity: approximately 4.15% at February 28 month-end, 4.43% as of March 27. Bloomberg U.S. Aggregate Bond Index: fell -1.76% in March; Q1 2026 total return -0.05%, per Confluence Financial Partners, “First Quarter 2026 Market Recap,” April 2026, citing Bloomberg data as of March 31, 2026.
  6. IEA, Oil Market Report, March 2026. OPEC+ spare capacity approximately 3.5 mb/d. IEA coordinated emergency stock release; U.S. Energy Secretary Chris Wright indicated a release that could approach 3 mb/d per CNBC, March 12, 2026.
  7. Federal Reserve, “Federal Reserve Issues FOMC Statement,” March 18, 2026; Federal Reserve, Summary of Economic Projections, March 18, 2026. Federal funds rate held at 3.50%-3.75%; 11-to-1 vote.
  8. Federal Reserve, Summary of Economic Projections, March 18, 2026. GDP median revised to 2.4% for 2026; PCE inflation median revised to 2.7% for 2026 (+0.3 percentage points vs. December 2025 projections). Median end-2026 federal funds rate projection 3.4%, implying approximately one additional 25 basis point cut.
  9. CNBC, “Fed Interest Rate Decision March 2026,” March 18, 2026; Kiplinger, “March Fed Meeting: Updates and Commentary,” March 18, 2026. Seven of 19 FOMC participants projected no cut in 2026.
  10. Bureau of Labor Statistics, Consumer Price Index Summary, February 2026 (bls.gov). February CPI +2.4% year-over-year; January CPI +2.4% year-over-year (down from 2.7% in December 2025); core CPI (all items less food and energy) +2.5% year-over-year.
  11. FactSet, Earnings Insight, week of April 2, 2026 (insight.factset.com). Q1 2026 blended EPS growth estimate: 13.2% year-over-year, which would mark the sixth consecutive quarter of double-digit earnings growth. Energy and Information Technology sectors recorded the largest upward EPS revisions since December 31.
  12. Bureau of Labor Statistics, Job Openings and Labor Turnover Survey (JOLTS), March 2026 release (bls.gov), reporting February 2026 data. Job openings fell 358,000 to 6.882 million at end of February 2026. U.S. EIA Short-Term Energy Outlook, March 2026 (eia.gov): gasoline prices forecast approximately 60 cents/gallon higher in March due to higher crude prices; national average exceeded $4/gallon by end of March per TPFG Market Pulse March 2026 (citing Bloomberg).
  13. S&P Global Market Intelligence, “Global Economic Outlook: March 2026,” March 2026. U.S. and Canada characterized as net energy exporters facing relatively mitigated Hormuz economic impact. Index return figures cross-referenced against endnote 4.
  14. Bloomberg. Returns of Market Indices chart data as of March 31, 2026. EAFE is MSCI EAFE Index; Emerging Markets is MSCI Emerging Markets Index; U.S. Bonds is Barclays U.S. Aggregate; ACWI is the MSCI ACWI Index; Small Caps is the Russell 2000 Index; S&P 500 is the S&P 500 Index. March 2026 returns shown.

Small/Mid Cap Stocks: An Attractive Opportunity

Crestwood believes equities offer strong growth potential for long term investors. We continuously analyze capital markets trends and data to inform our long-term equity strategy and identify shorter-term opportunities. Our analysis indicates that, given current market conditions, U.S. Small/Mid (SMID) cap stocks have the potential to outperform large cap stocks.

SMID Currently Trading at a Wide Discount

For much of the past 30 years, U.S. Small/Mid (SMID) cap stocks have traded at a premium valuation compared to their U.S. large-cap counterparts. Traditionally, investors sought SMID cap stocks to gain exposure to higher expected earnings growth to complement more mature and relatively slower-growing large-cap stock holdings. However, since early 2021, SMID cap stocks have traded at valuation discounts relative to large-caps in a range not experienced since the 2000 tech bubble. We believe this discount represents an attractive investment opportunity.
Below is a chart demonstrating the price-to-earnings ratio of the mid-cap stock index to that of the large-cap S&P 500 index for the past 20 years. Notably, mid-cap stocks currently trade at a 24% discount to large-cap stocks.

In the shadow of the Mag 7

For the past two years, investors have focused on the Magnificent Seven (Mag 7) companies – Apple, Microsoft, Alphabet, Amazon, Meta Platforms, Nvidia and Tesla – which have been a significant driver of large-cap stock market performance. Since January 2023, these stocks surged 254%, compared to the S&P 500’s 63% gain. Impressively, the Mag 7 companies have grown earnings by over 130%, capturing investor enthusiasm, especially for those benefiting from the development of artificial intelligence platforms. Enthusiasm for AI focused companies has overshadowed small-cap and mid-cap stocks which have fallen out of favor.

Attractive characteristics

When examining valuation as an investment factor, it is essential to ensure underlying fundamentals are healthy. Sometimes investments may appear inexpensive but carry low valuations for good reason and are priced appropriately. When looking at the stocks in the small-cap and mid-cap indexes however, we believe their fundamentals are healthy and improving:

1. Faster Growing: Over the past seven years, SMID cap earnings have grown faster than large cap earnings and they are expected to continue growing faster in the coming years.
2. Improving Businesses: Over the same time frame, SMID caps have improved free cash flow yields, margins, and returns on invested capital to comparable levels to large caps.
3. No Substantial Increases in Debt: Both SMID and large-cap debt levels are at their historical averages.

Why Now?

Several catalysts make now an opportune time to increase our exposure to SMID cap stocks:

1. Economic growth: SMID cap earnings tend to be more cyclical and rise and fall with economic growth. The current economic outlook is for healthy consumer spending and a resilient job market
2. Deal Activity: Anticipation of reduced regulatory scrutiny under the Trump administration is fueling expectations of increased merger and acquisition (M&A) activity. Higher M&A activity is a positive catalyst for SMID caps as they are often targets for these types of deals.
3. New Administration Tariffs: How substantial, impactful, or disruptive the tariffs may or may not be is still widely unknown. However, SMID caps have roughly half the exposure to foreign revenue as large caps, making them an attractive diversifier against potential global trade disruptions caused by tariffs.

In summary, SMID cap stocks are notably underappreciated by the broader market, presenting a compelling investment opportunity. Given today’s favorable economic environment, we believe their strong fundamentals combined with attractive valuations offer an appealing opportunity and may offer an important return and diversification benefit to client portfolios.

Sources: Bloomberg, Citibank. Mid-Cap stocks are represented by the S&P 400 Index, Large-Cap stocks are represented by the S&P 500 Index. The Magnificent Seven (Mag 7) returns are represented by the Bloomberg Magnificent 7 Index.

The Global Trading System – Time for a Reboot?

Since 1980, US trade policy has been largely pro-trade which has allowed unfettered access to US markets for goods and capital. During this time, countries like China aggressively increased exports via state-supported industries, which distorted the US economy through large trade deficits and lost manufacturing and capital inflows.

Undoubtedly, US consumers have benefitted from inexpensive imported goods. However, trade is a double-edged sword. Less expensive imports mean less demand for US goods which harms US manufacturers and workers. Falling living standards for workers, especially in rural areas, has increased voter frustration and spurred the rise of populism.

This article is meant to provide a basic framework for understanding trade deficits, capital flows, and the implications of remedies like tariffs. After the 2024 election, one thing is clear – voters are tired of listening to pro-trade rhetoric and want results, in the form of higher wages and living standards.

Unfair Trade  

Economists tell us that all countries can benefit from trade by exchanging goods from the industries in which they have a low-cost production advantage. While true, countries like China have taken extraordinary measures to support their export industries, benefits which US manufacturers do not enjoy. The Chinese government supports producers with access to cheap credit, lax environmental policies, repression of workers’ wages, and a favorable currency exchange rate. China spends considerable financial effort controlling the value of its currency, the Renminbi. Weakening the Renminbi reduces the prices of goods exported to the US and increases China’s competitiveness. China has used these beggar-thy-neighbor strategies to export subsidized goods to the US and other developed countries, taking market share and crushing competitors.

All the inexpensive imports have devastated US manufacturing. From its peak in 1979 to 2019, manufacturing employment in the US has been gutted, with the loss of approximately 6.8 million jobs including a loss of over 80% of employment in the textile industry.This decline has hit rural communities especially hard given the lack of other well-paying job opportunities in these areas. Since 1979, US manufacturing has declined from 22% of nonfarm employment to just 9% in 2019.ii As seen in the chart below, China comprises a whopping 29% of global manufacturing while only 17% of global GDP.iii  

The pace of China’s manufacturing expansion is unprecedentediv and has forced down manufacturing across the developed world.

Trade Imbalances Distort Capital Flows, too

In exchange for goods, foreign surplus economies receive US Dollars which are typically re-invested in US Dollar assets. Exporting countries prefer not to exchange these US Dollars through currency markets for fear of depressing the value of the US Dollar and raising the value of their home currency (or whatever currency they purchased). This preference helps explain why trade deficits are not self-correcting as countries keep US Dollar assets to maintain a currency advantage. For September 2024, the reported monthly trade deficit was $84b, which means foreigners bought roughly $84b in US assets that month. Over time, these purchases of US assets accumulate and are substantial. As illustrated in the chart below, foreigners own over $7 trillion of US Treasuries, which is 22% of the total, and more than the amount the Federal Reserve holds via its quantitative easing programs.v

Economists incorrectly worry that countries may stop buying US debt; exporting countries have little choice but to buy US assets to maintain a trade advantage through exchange rates. The purchase of US assets represents a capital inflow of excess capital as the US has plenty of capital to meet its investment needs – just look at the $2.6t in dry powder at private equity firms.vi Excess capital can lead to asset bubbles and potential economic instability.

Tariffs and Measures to Reform Trade

Countries that run a trade surplus (China, Germany, and Vietnam, for example) should face incentives to consume more of their production at home. Those incentives could include tariffs, capital flow restrictions, and new trade agreements that focus on balanced trade with commitments to curb exports to the US and consume more US exports. During his campaign, President Trump promised a wide array of tariffs, even considering them a meaningful source of revenue for the US Treasury.

While all of these measures have shortcomings, there are a few concerns about tariffs:

  • Targeted country tariffs have shown little success. Since 2018, the US has enacted several country-specific tariffs that have had little impact on the overall trade deficit. While targeted tariffs reduced reported trade from China, many exporters rerouted Chinese goods through other countries like Vietnam, Taiwan, and Mexico and avoided paying tariffs.vii
  • Across-the-board tariffs will have unintended consequences. While solving the rerouting issue, broad tariffs would likely raise prices for items we may never produce like bananas or popular consumer items like iPhones. Further, across-the-board tariffs will likely increase prices generally, considering the time and investment it takes to relocate production to the US.

Global role of US Dollar

Another point of consideration is the role of the US Dollar as the world’s dominant currency. The US Dollar comprises 54% of foreign trade invoices and 59% of foreign currency reserves.viii Unfortunately, the US pays a cost for the global role of the US Dollar through increased capital inflows and a higher value of the US Dollar. While many believe a strong US Dollar shows US economic strength, it counteracts the effect of tariffs. The US should focus on lowering the value of the US Dollar to help domestic manufacturing and raise the cost of imported goods.

The US may consider a multifaceted approach to fixing trade – well-designed tariffs, limits on foreign asset purchases, and trade agreements focused on balanced trade. Importantly, the US needs to lower the value of the US Dollar through policies that could include reducing the role of the US Dollar in global finance. However, fixing the global trading system will take time.

Takeaways 

As we think about pending tariffs from the Trump administration, here are a few takeaways:

  • Change is coming: The 2024 election shows that voters believe the global trading system is badly broken and needs to be fixed.ix Tariffs aren’t perfect but may prove a good starting point for a discussion about what the US wants for fair trade.
  • Timing: Changes in tariffs will take some time to implement with the earliest impact near the end of 2025. Most likely, higher tariffs will take effect in 2026.
  • Higher prices: Imports are 14% of US GDPx, so across-the-board tariffs will have a large economic impact. Goldman Sachs’s tariff rule of thumb is every 10% increase in the US tariff rate would increase inflation by 1.0%.xi
  • Manufacturing rebuild: Rebuilding the manufacturing base will take time – think decades given complex supply chains and existing manufacturing bases. Manufacturing companies will want to see durable change before building a new plant, not tariff policies which could change every four years.

At Crestwood, we continue to watch for economic changes that may impact your investments. Importantly, we focus on constructing diversified portfolios designed to weather storms which include changes to industrial policy. Financial markets try to anticipate these changes and frequently overreact based on emotions. We believe it important to keep an eye on the long term and focus on durable changes to policy that may affect financial markets and possibly portfolios. Constructive policies on reshaping trade to a greater balance between imports and exports could have the potential to increase US GDP growth and raise living standards across the US. We will be watchful for policy changes and continue to position portfolios to meet clients’ long-term goals.


iForty years of falling manufacturing employment, Harris U.S Bureau of Labor Statistics: https://www.bls.gov/opub/btn/volume-9/forty-years-of-falling-manufacturing-employment.htm
iiIbid.
iii“Trade Intervention for Freer Trade” Pettis and Hogan 2024 Carnegie Endowment for International Peace: https://carnegieendowment.org/research/2024/10/trade-intervention-for-freer-trade?lang=en
ivIbid.
v“The US breached $34 trillion in national debt. Here’s who owns every dime.” Rosaria Straight Arrow News
https://san.com/cc/the-us-breached-34-trillion-in-national-debt-heres-who-owns-every-dime/
vi“Private equity dry powder growth accelerate in H1 2024” S&P Global https://www.spglobal.com/marketintelligence/en/news-insights/latest-news-headlines/private-equity-dry-powder-growth-accelerated-in-h1-2024-82385822
vii(Still) Made in China: how tariff hikes may trigger re-routing circumvention Shi and Liu 2019, CEPR https://cepr.org/voxeu/columns/still-made-china-how-tariff-hikes-may-trigger-re-routing-circumvention
viii“The changing role of the US dollar” Boocker and Wessel, Brookings
https://www.brookings.edu/articles/the-changing-role-of-the-us dollar/#:~:text=The%20dollar%20makes%20up%20a,of%20foreign%20trade%20invoices%20globally.
ix“Trade Intervention for Freer Trade” Pettis Hogan 2024 Carnegie Endowment for International Peace: https://carnegieendowment.org/research/2024/10/trade-intervention-for-freer-trade?lang=en
xSt Louis Federal Reserve FRED https://fred.stlouisfed.org/series/B021RE1A156NBEA
xi“Global Economic Comment: Economic Impacts of Tariff Proposals on USMCA Participants” Briggs, Phillips and Ramos 2024 Goldman Sachs

Investment Research Analyst Discusses S&P 500 Index Funds with U.S. News & World Report

In a recent conversation with U.S. News & World Report, Investment Research Analyst Joe Alger, CFA, shared key insights on how different replication strategies impact the performance of popular S&P 500 index funds.

“Funds that use a full replication method of an index are likely to have lower tracking errors than funds that use partial or optimized replication methods,” he said.

Read the full article by clicking here.

Partner and Chief Investment Officer Discusses Navigating Popular Trades with Financial Planning

Jumping on the latest trend may seem like a great idea in the moment, but will it set you up for the future you desire?

Partner and Chief Investment Officer John Ingram shared his thoughts on investing in Nvidia and other currently popular trades with Financial Planning.

“We all need guardrails to prevent us from buying an Nvidia at the top of the market — if this is a top. And I’m not predicting that it is, but if it is a top, do our guardrails prevent us from buying it at this price and then losing our shirt on the way down?” he said.

Click here to read the full article.


Crestwood Advisors Portfolio Manager Discusses ETFs and Index Funds Pros and Cons with CNN

Want to invest smartly but can’t decide between ETFs and index funds? While both offer a diversified, low-cost way to grow your wealth over time, they also have unique advantages and disadvantages.

Crestwood Advisors Portfolio Manager Jimmy Doogan, CFA, recently spoke with CNN on the pros and cons of these popular investment options.

Make the best choice for your financial future – read his insights by clicking here

Director, Portfolio Manager Discusses Bond Investing Ahead of Fed Rate Cuts with Financial Advisor Magazine

To the disappointment of many, the Fed has shown it’s not yet ready to cut interest rates. However, this could be beneficial for fixed-income investors if they act fast.

Director and Portfolio Manager Jason Hendricks, CFP®, ChFC®, CSRIC® shared with Financial Advisor Magazine that owning intermediate maturity bonds “allows investors to lock in yields [and] likely see a rise in principal when the Fed cuts rates.”

Click here to read the full article.