The Paperwork Nobody Packs for College

Many parents are surprised to learn that when their child turns 18, most of their legal authority ends.  You’ve handled every doctor’s visit and signed every school form for years.  But if your college freshman ends up in an emergency room far from home, the hospital might not be able to share any information with you.  It’s not that the staff is unhelpful, the law now considers your child an adult.

There are a few simple documents that can help:

  • Health care proxy (sometimes called a medical power of attorney): This lets your student choose someone they trust to make medical decisions if they are unable to speak for themselves.
  • HIPAA authorization: This gives doctors and hospitals permission to share medical information with the family members your student selects.
  • Durable financial power of attorney: This allows a trusted person to take care of banking, bills, or housing issues if the student can’t do it themselves.
  • FERPA waiver: This lets the college share educational records with parents or other people your student names. Most schools have their own form, so check with the registrar’s office.

Will you ever need these documents?  Probably not, and that’s what everyone hopes.  But emergencies can happen at any time, and the last thing you want is to find out you’re locked out of important information during a crisis.

So, while you’re shopping for twin XL sheets and discussing the mini fridge, add these documents to your checklist.  Spending an hour on paperwork now can save your family a lot of stress later.

At Crestwood, we believe simplifying wealth includes getting ready for milestones like this and the surprises they can bring.  If your child is turning 18 or going to college, we’re here to help you begin the conversation with your attorney.

Contact us. 

Crestwood Advisors Included in Financial Advisor Magazine’s 2026 RIA Survey & Ranking

Recognition follows another year of momentum and continued commitment to client-centered wealth management

BOSTON (July 16, 2026) – Crestwood Advisors (“Crestwood”), a boutique investment advisory and wealth management firm based in Boston and with offices in Connecticut and Rhode Island, today announced its inclusion in Financial Advisor Magazine’s 2026 RIA Survey & Ranking.

The recognition follows another year of continued growth for Crestwood, with assets under management increasing 14% year over year.

Each year, Financial Advisor Magazine surveys hundreds of independent registered investment advisory firms for its annual RIA Survey & Ranking, which highlights firms demonstrating sustained growth and long-term success across the independent advisory industry. The ranking itself is based on assets under management reported by participating firms that file their own Form ADV with the SEC.

“We’re proud to once again be included in Financial Advisor Magazine’s RIA Survey & Ranking,” said Leah R. Sciabarrasi, CFP®, President and Managing Partner of Crestwood Advisors. “Our growth has always been driven by a long-term commitment to our clients. As we continue to evolve, we’re focused on strengthening our team and expanding our expertise while staying true to the values that have guided Crestwood since the beginning.”

Crestwood’s continued inclusion in the annual ranking reflects the firm’s steady momentum and disciplined approach to delivering personalized guidance tailored to each client’s unique goals. As the firm continues to grow, Crestwood remains committed to helping individuals and families build, preserve and transfer wealth through comprehensive financial planning and investment management.

The full Financial Advisor Magazine 2026 RIA Survey & Ranking can be found here. Crestwood did not pay a fee to appear on the published list.


###


About Crestwood Advisors 

Crestwood Advisors is an independent, fee-only, wealth management firm with approximately $8.02 billion in assets under management as of Dec. 31, 2025. Founded in 2003, Crestwood Advisors provides investment management with financial planning strategies to help high-net-worth individuals and families identify and prioritize their goals and build sustainable wealth so that they may enjoy more financially secure and purposeful lives. For more information, please visit https://www.crestwoodadvisors.com.

July 2026 Economic and Market Update: The Mega-IPO Era Arrives

June delivered the largest IPO in the history of the U.S. equity market. On June 11, SpaceX priced 555.6 million shares at $135 per share, raising $75 billion. Shares began trading the next day, June 12, opening at $150 and closing at $160.95, a 19% first-day gain that pushed its market capitalization above $2 trillion.1 The size of the offering is only part of the story. The mechanics of the deal, and more importantly the rule changes that surround it, will affect portfolio construction for the next several years. The three big index providers each drew a different line on whether SpaceX belongs in their benchmarks, and OpenAI and Anthropic are widely expected to follow with similar sized offerings.

Mega IPOs and What Investors Actually Get

SpaceX’s IPO valued the company at $1.77 trillion which is close to 100x its 2025 revenue of $18.67 billion while also showing a Net Loss of $4.94 billion. 1 Approximately 4.2% of the company’s total shares were sold to the public, of which roughly 30% were allocated to retail investors, an unusually high proportion for an IPO. 2  The stock hit an intraday high of $225.64 on June 16, a 67% gain from the IPO price in three trading sessions, before selling back to $147.11 on June 23, a 34% drop from the high. It closed the month around $170 and traded around $150 at the time of publication.3  Fig. 1 illustrates an observable pattern across 25 US Mega IPOs of the past 15 years.4 5

Fig 1:

Source: Bloomberg terminal. Crestwood Advisors analysis of daily closing prices for 25 US large IPOs from 2011-2021, indexed to each company’s IPO offering price = 100 and computed empirically across the sample at each trading day. SpaceX actual path shown for reference only and is not intended to predict future performance. 
  • Post-IPO volatility is a documented pattern, not a SpaceX-specific phenomenon: Academic research on IPO price behavior spanning four decades finds that newly listed stocks trade with meaningfully higher volatility than seasoned stocks. Renaissance Capital data shows 30-day post-IPO volatility is approximately 45-50% higher for recent IPOs compared to seasoned stocks in the same market. A remarkable 41% of 2023 IPOs delisted within five years, with 29% attributed to poor performance.
  • The lockup expiration effect is real and measurable: The standard IPO lockup which prevents insiders and pre-IPO investors from selling for the first 180 days after listing, is nearly universal. The seminal peer-reviewed study of IPO lockups, covering 2,529 firms from 1988 to 1997, found a statistically significant negative abnormal return in the trading days surrounding lockup expiration, with the effect concentrated in venture-backed technology firms.6
  • The float matters more than the headline valuation: A stock’s float refers to the number of a company’s shares available for investors to trade and does not include restricted stocks held by insiders. A low float amplifies the price impact of both buying and selling pressure. With only 4.2% of SpaceX’s shares in the public float at issuance, and 30% of that allocation directed to retail investors, the available supply for institutional buyers is thin. When lockups expire, the float can expand by several multiples in a single window which could exacerbate volatility.1

Implications for Investors: Mega IPOs are not an asset every investor needs to own on day one. The academic and empirical record is consistent: first year post-IPO price divergence is wide, the lockup expiration window is associated with selling pressure, and the median mega IPO trades below its listing price for much of its first two years. For investors considering direct participation in future mega listings, patience typically rewards more than speed. Getting in early is not a guarantee of excess returns. The relevant question is not whether the company is fundamentally worth its market capitalization, but whether the current price reflects the mechanical supply-demand dynamics of a low-float IPO or the underlying business.

Index Inclusion: Who Buys, When, and How Does This Impact the Market?

The passive investing ecosystem is now large enough that index inclusion materially moves stock prices. S&P Dow Jones Indices estimated that approximately $20 trillion of investment assets were benchmarked to the S&P 500 as of December 2024, with roughly $13 trillion in passively managed assets.7 When an index adds a stock, funds tracking that index must buy it, regardless of price. The mechanics of this forced buying have become a distinct market phenomenon, and the divergence between how the major index providers approach mega IPOs will create meaningfully different exposures across benchmarks.

  • Index inclusion rules diverged sharply this year:
    • S&P Dow Jones chose to preserve its existing eligibility criteria for the S&P 500. New additions must meet a 12-month seasoning requirement, must be GAAP-profitable in the most recent quarter and cumulatively over the trailing four quarters, and must satisfy minimum public float requirements. SpaceX, which posted a $4.94 billion net loss in 2025, is not eligible for the S&P 500 until at least mid-2027, and only then if it achieves GAAP profitability.
    • Nasdaq, revised their methodology to allow any newly listed company in the top 40 by market capitalization to enter the Nasdaq-100 after just 15 trading days, with no minimum float requirement.
    • FTSE Russell also revised their rules and confirmed SpaceX will enter the Russell 1000 at the September or December 2026 quarterly reconstitution.
    • MSCI, which has had a 10-trading-day inclusion rule since 2007, kept its existing methodology and likewise CRSP allows fast-track IPO inclusion after just 5 trading days.7 8 9
  • The Tesla precedent shows the mechanics of forced buying: The most relevant recent template is Tesla’s addition to the S&P 500 on December 21, 2020. On November 16th, S&P announced Tesla would be added to the index on December 18th. Because Tesla’s weight at inclusion was approximately 1.7% of the index, passive funds tracking the S&P 500 needed to buy an estimated $50 billion to $80 billion of shares to align their portfolios with the new index composition. The actual buying was heavily concentrated in the last trading day before inclusion. Over 200 million Tesla shares traded that day, including roughly 69 million shares, worth approximately $50 billion, in the electronically managed closing auction alone. The stock’s price gyrated wildly in the final minutes as active traders who had front-run the passive buying looked to sell into the mandatory demand. The Tesla mechanic shows a pattern: an announcement, a five-week preparation window, front-running by active investors, and a concentrated buying surge on or near the effective date.10
  • The buying is funded by proportional selling across the index: Index funds run essentially fully invested, with cash balances typically under 1% of assets. When a new name is added, the required purchases are funded primarily by proportional trimming of every other constituent, not by simply selling the specific name being removed to make room. When SpaceX enters the Nasdaq-100 at an estimated 0.47% to 0.70% initial weight, index funds tracking the Nasdaq-100 must reduce their positions in each of the other 100 constituents by that same proportional amount to fund the SpaceX buy. On a rough estimate, if the Nasdaq-100 tracking ecosystem needs to allocate approximately $7 billion of new capital to SpaceX at inclusion, that same $7 billion is distributed across the other 100 names as proportional selling pressure, equating to roughly $70 million of selling per constituent. Individually, that is a rounding error for the largest names, but it can be more meaningful for smaller constituents. When SpaceX eventually qualifies for the S&P 500, the same mechanic applies on a much larger scale: an estimated $50 billion or more of forced buying, funded by proportional selling across all 499 other index constituents. The forced buying story is really two stories at once: mechanical demand for the incoming name, and mechanical selling pressure diffused across everything else the index owns.7 9
  • The Facebook precedent shows how long the S&P is willing to wait: Facebook went public in May 2012 at a valuation of approximately $104 billion, at the time the largest US technology IPO in history. It was not added to the S&P 500 until December 2013. The delay was partly a function of the seasoning requirement, partly the stock’s post-IPO price weakness (Facebook traded below its $38 IPO price for most of its first year), and partly the S&P Index Committee’s judgment that the social media sector did not yet require dedicated representation. S&P’s willingness to make the Facebook cohort wait is the same posture it has now taken with SpaceX, and by extension with Anthropic and OpenAI when they list.11
  • Estimated forced buying: near-term and delayed: Bloomberg Intelligence estimates that passive funds tracking the Nasdaq-100 and Russell 1000 will ultimately need to acquire shares equal to approximately 24% of SpaceX’s public float, with a subsequent S&P 500 inclusion adding demand for another 19% of the float. Once actively managed funds benchmarked to those indexes are included, more than half of SpaceX’s public float becomes mechanical demand. Goldman Sachs estimates that the Nasdaq-100 inclusion alone could trigger as much as $60 billion of forced buying. The precise amounts vary across methodologies, but the broader pattern is consistent: multiple waves of mechanical buying associated with the Nasdaq-100 and Russell 1000 in 2026, followed by a substantially larger and more concentrated buying event once SpaceX becomes eligible for inclusion in the S&P 500.12 13

Implications for Investors: The Tesla precedent is instructive. In the five weeks between S&P’s November announcement and the December effective date, Tesla shares rose appreciably, reflecting both investor enthusiasm and positioning ahead of the anticipated wave of passive index buying. If similarly large companies such as SpaceX, Anthropic, or OpenAI ultimately become eligible for inclusion in the S&P 500, comparable market dynamics may emerge. Investors should expect volatility across equity markets both immediately following a mega IPO as well as during the time when each new leviathan is being purchased by index funds.

Trends We’re Watching

  • Oil’s round trip: The June 17 U.S.-Iran ceasefire and reopening of the Strait of Hormuz drove one of the fastest oil price reversals on record. Brent crude peaked at $118 per barrel in April and closed June near $73, a 38% decline in ten weeks. The EIA now projects Brent averaging $70 per barrel by year-end, assuming no resumption in hostilities. There have been multiple rounds of announcements of potential resolutions to the conflict and impacts are still rippling through the global economy.14
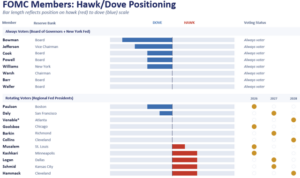
  • The Warsh Fed’s hawkish debut: Kevin Warsh’s first FOMC meeting on June 17 held the federal funds rate at 3.50% to 3.75% by a unanimous 12-to-0 vote. The June Summary of Economic Projections (aka the Dot Plot) revised the median 2026 federal funds rate up to 3.8% from 3.4% in March. Nine of 18 committee members project at least one rate hike in 2026. This implies the next move could just as easily be a hike as a cut. The FOMC statement was cut to 130 words from 341, forward guidance was removed, and Warsh announced five task forces to overhaul Fed communications, monetary policy operations, data sources, productivity analysis, and inflation measurement.15 16
  • AI capex hits the consumer at the cash register: Apple raised prices on select MacBook and iPad models on June 25, with increases of up to $300 (18% to 25%) on premium configurations. Microsoft followed hours later with Xbox console price increases of $100 to $150 effective August 1. Both companies attributed the increases to memory chip costs, which have more than doubled since 2025 and are expected to double again by fall 2027 as AI data-center demand crowds out consumer electronics. The AI capex cycle we discussed in April is now feeding directly into consumer prices, and this pass-through is likely to continue for at least two more years.17


The Takeaway

Three practical takeaways emerge from the month:

First, investors should be cognizant that the newest cohort of large listings will be absent from the S&P 500 and many Quality-focused strategies until each achieves GAAP profitability. If these newcomers perform well out of the gate, this could lead to a period of short-term underperformance, particularly as retail investors and those subject to FOMO chase the latest and greatest IPO.

Second, investors considering direct participation in future mega listings should be mindful that the academic and empirical record supports patience: post-IPO paths widen before they narrow, and the median mega IPO trades below its listing price for much of its first two years. This volatile post-IPO period is where Quality investors are more likely to gain ground, favoring the newcomers who demonstrate profitable business models and avoiding companies who struggle to generate positive cash flow.

Third, investors should continue to monitor bond duration and favor higher-quality fixed income while the Fed’s hawkish posture and the additional energy-related inflation risk both remain unresolved.


Returns of Market Indices  |  June 2026

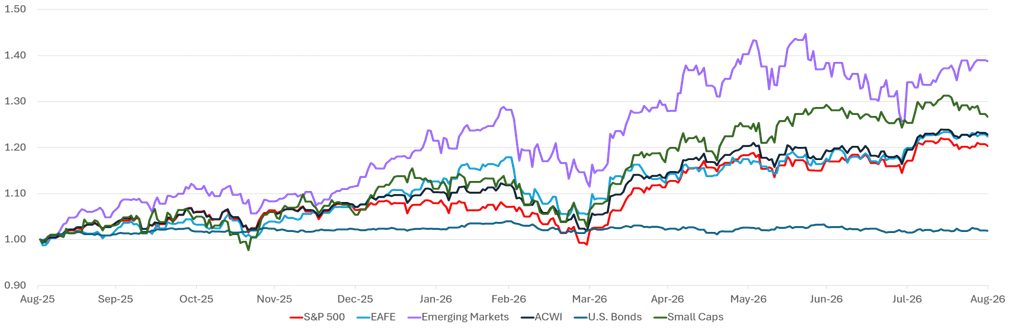
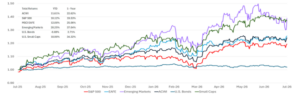
U.S. equities were mixed in June as post-IPO trading, cooling AI leadership, and consumer-price increases from Apple and Microsoft weighed on late-month sessions. The S&P 500 closed the month near record levels, but down slightly for the month (-1%). Global Equities were likewise slightly down (MSCI ACWI -0.8%). Developed International equities were slightly positive (MSCI EAFE +0.1%) while Emerging Market equities were down (MSCI EM Equity -1.4%). U.S. Small and Mid Caps had a strong month (Russell 2000 +3.7%). Bond investors saw a flatter curve on the day of the June FOMC meeting: the Warsh Fed’s hawkish dot plot pushed the 2-year yield higher while long-end yields moved less, though Treasuries recovered ground later in the month as oil prices retreated. Overall, this left bond prices slightly positive for the month (Bloomberg U.S. Aggregate Bond +0.24%). Year to Date returns are shown in Fig 2.

Past performance is not indicative of future results. Index returns represent total return. Source: Bloomberg.

Sources
  1. SpaceX S-1 Registration Statement (SEC filing, public May 20, 2026); CNBC, “SpaceX IPO takeaways: SPCX closes at $161, jumping 19% after record debut,” June 12, 2026 (cnbc.com); TechCrunch, “SpaceX officially prices shares at $135 in the largest IPO ever,” June 11, 2026. IPO priced 555.6 million shares at $135 per share; total shares outstanding approximately 13.076 billion; first-day close $160.95 (+19.2%); market capitalization at IPO price approximately $1.77 trillion. 2025 revenue $18.67 billion; 2025 GAAP net loss $4.94 billion. Public float approximately 4.2% of shares outstanding.
  2. CNBC, “SpaceX IPO explained: The price is set, but retail allocation still up in the air,” June 9, 2026 (cnbc.com). Approximately 30% of IPO shares allocated to retail investors, roughly $22.5 billion, distributed through Charles Schwab, Fidelity, Robinhood, SoFi, and E*TRADE. Typical retail IPO allocation is 5% to 10%.
  3. Yahoo Finance, MacroTrends, and Investing.com historical price data for SPCX, accessed July 2, 2026. SpaceX all-time high $225.64 on June 16, 2026; all-time low $147.11 on June 23, 2026; June 30 close $170.86; July 7 close $149.47. Average daily volume approximately 80 million shares. Nasdaq-100 estimated initial weight 0.47% to 0.70% per Nasdaq index methodology.
  4. Renaissance Capital IPO market data, accessed June 2026 (renaissancecapital.com). 30-day post-IPO annualized volatility for 2023 US IPOs approximately 22% vs. 15% for seasoned stocks (approximately 45% to 50% higher on a relative basis). Approximately 41% of 2023 IPOs delisted within 5 years, with 29% attributed to poor performance.
  5. 5. Crestwood analysis. Bloomberg terminal, daily closing prices for the first 500 trading days after IPO. Prices indexed to each company’s IPO offering price = 100. Percentile bands and median line computed empirically across the 25-stock sample at each trading day, with light smoothing applied. Final IPO prices rounded to the nearest whole percentage. Groupon prices adjusted for its 1-for-20 reverse split (June 2020); direct listings (Slack, Palantir, Roblox, Coinbase) indexed to exchange reference price. 25-stock group: Groupon (GRPN), Zynga (ZNGA), Facebook/Meta (META), Workday (WDAY), Tableau (DATA), Twitter (TWTR), Hilton (HLT), Ally Financial (ALLY), Alibaba (BABA), Snap (SNAP), Lyft (LYFT), Pinterest (PINS), Zoom (ZM), Uber (UBER), Slack (WORK), Snowflake (SNOW), Palantir (PLTR), DoorDash (DASH), Airbnb (ABNB), Bumble (BMBL), Roblox (RBLX), Coupang (CPNG), Coinbase (COIN), Robinhood (HOOD), Rivian (RIVN).  SpaceX daily closing prices are shown for June 12 through July 2, 2026.  SpaceX path shown for reference only and is not intended to predict future performance.
  6. Field, L.C. and Hanka, G. (2001), “The Expiration of IPO Share Lockups,” Journal of Finance, 56: 471-500. Sample of 2,529 firms 1988-1997; lockup expirations associated with significant negative abnormal returns of approximately 1.5% in the immediate event window, concentrated in venture-backed firms. Ofek, E. and Richardson, M. (2000), “The IPO Lock-Up Period: Implications for Market Efficiency and Downward Sloping Demand Curves,” NYU Stern working paper. Bradley, D.J., Jordan, B.D., Roten, I.C., and Yi, H.-C. (2001), “Venture Capital and IPO Lockup Expiration: An Empirical Analysis,” Journal of Financial Research, 24: 465-493.
  7. Morningstar, “The SpaceX IPO: How Index Funds Are Adapting,” June 2026 (morningstar.com). S&P Dow Jones Indices consultation results announced June 4, 2026: no changes to S&P 500 eligibility criteria. Nasdaq revised methodology effective May 1, 2026, allowing top-40-by-market-cap fast entry after 15 trading days. FTSE Russell relaxed 5% float minimum. CRSP allows fast-track inclusion after 5 trading days for eligible IPOs. MSCI retained its 10-trading-day inclusion rule (in place since 2007). S&P Dow Jones Indices estimated approximately $20 trillion indexed or benchmarked to the S&P 500 as of December 2024, with approximately $13 trillion in passive assets. Index fund methodology on cash balances and rebalancing mechanics: index funds run at cash balances typically below 1% of assets and fund new-name inclusions via proportional trimming of existing constituents.
  8. CNBC, “SpaceX blocked from early U.S. benchmark index entry as S&P reaffirms existing rules,” June 5, 2026 (cnbc.com). S&P Global Ratings statement: exceptions to financial viability, seasoning, and IWF requirements will not be granted solely based on market capitalization. GAAP profitability requirement for S&P 500 inclusion unchanged.
  9. Vanguard, “Stay grounded on moonshot IPOs,” June 8, 2026 (corporate.vanguard.com). Comparative summary of index provider approaches to mega IPOs and index fund rebalancing mechanics. Charles Schwab, “Some Indexes Accelerate Entry for Massive IPOs,” June 2026 (schwab.com). Both sources describe the standard practice of funding new-name index inclusions through proportional selling of existing constituents rather than through cash balances or single-name replacement.
  10. S&P Dow Jones Indices press release, “S&P Dow Jones Indices Announces Changes to the S&P 500 Index,” November 16, 2020. Forbes, “Will Tesla Break The S&P 500? (Part 2): The Mechanics Of Market Turmoil,” January 4, 2021; Forbes, “Will Tesla Break The S&P500? (Pt 3): Did The Way It Was Added Help Create A Bubble?,” January 10, 2021. Tesla added to S&P 500 effective December 21, 2020 in a single-step addition. Approximately 69 million shares (~$50 billion) traded in the closing auction on December 18, 2020; total daily volume exceeded 200 million shares. Weight at inclusion ~1.7% of index. Front-running dynamics drove Tesla shares up approximately 70% between the November 16 announcement and the December 21 effective date.
  11. S&P Dow Jones Indices announcement, December 11, 2013. Facebook added to S&P 500 effective December 20, 2013, approximately 19 months after its May 18, 2012 IPO. Facebook IPO priced at $38 per share; traded below $38 for most of its first year post-listing.
  12. CME Group, “The SpaceX Mega-IPO: Why Index Choice Matters,” June 2026 (cmegroup.com) citing Bloomberg Intelligence estimates. Bloomberg Intelligence estimated combined Nasdaq-100 and Russell 1000 fund inclusion would absorb approximately 24% of SpaceX’s public float; subsequent S&P 500 inclusion, when it eventually applies, would add another 19%. Fortune, “If S&P Dow Jones rewrites its listing rules SpaceX and Anthropic will benefit, investors won’t,” June 2, 2026 (fortune.com), citing Goldman Sachs analyst estimates.
  13. Goldman Sachs Group research, cited in Fortune (June 2, 2026) and multiple financial press reports. Estimated Nasdaq-100 fast-entry methodology change could trigger up to $60 billion in aggregate forced buying across the Nasdaq-100 tracking ecosystem for large mega-cap IPOs.
  14. Capital.com and Reuters coverage of U.S.-Iran ceasefire, June 16-17, 2026; U.S. Energy Information Administration, Short-Term Energy Outlook, June 2026 (eia.gov). U.S.-Iran ceasefire signed June 17, 2026 including 60-day truce and agreement to reopen Strait of Hormuz. Brent crude fell from approximately $118 (April peak) to approximately $73 by end of June 2026, a decline of ~38%. EIA projects Brent averaging approximately $70/bbl by year-end 2026.
  15. Federal Reserve, FOMC Statement, June 17, 2026; Federal Reserve, Summary of Economic Projections, June 17, 2026 (federalreserve.gov). Federal funds rate held at 3.50%-3.75% by 12-to-0 vote (unanimous). Median 2026 federal funds rate projection revised to 3.8% (from 3.4% in March). Median 2026 PCE inflation projection revised to 3.6% (from 2.7%). Nine of 18 participants project at least one rate hike in 2026. Statement length reduced to 130 words from 341 in April statement.
  16. CNBC, “June FOMC: Fed holds interest rates steady as Warsh era begins,” June 17, 2026 (cnbc.com); Franklin Templeton, “June FOMC recap: It’s task force time,” June 18, 2026. Chair Warsh declined to submit his own dot to the SEP. Warsh announced five task forces to review Fed communications, monetary policy operations, data sources, productivity, and inflation measurement.
  17. Bloomberg, “Apple, Microsoft Raise iPad, Xbox Prices as AI Demand Drives Costs Higher,” June 27, 2026 (bloomberg.com); Wall Street Journal interview with Tim Cook, June 17, 2026 (wsj.com); Reuters coverage, June 25-26, 2026. Apple raised MacBook and iPad prices by up to $300 (18% to 25%). Microsoft raised Xbox prices by $100 to $150 effective August 1, 2026. Memory chip costs have more than doubled since 2025 and expected to double again by fall 2027. Apple shares fell approximately 6% on the announcement.

Managing Director & Wealth Strategist Katie Sheehan Shares Practical Steps for Creating a Strong Will With AARP

A well-crafted estate plan can help provide clarity for your loved ones and ensure your wishes are carried out.

Managing Director and Wealth Strategist Katherine Sheehan was recently featured in an AARP article discussing practical steps for creating a strong will, from minimizing the potential for family disputes to keeping estate plans up to date as life changes.

Read the full article here.

What Wealth Looks Like: A Summer Evening Well Spent

Most of us have a list of people we keep meaning to see.

The friend from years back. The neighbors you genuinely like. The list stays in your head. The plans never quite get made.

We say “We should get together soon”. We mean it. And then another few months go by.

It is not for lack of wanting. It is usually because gathering has started to feel like work. The right food. The right setting. Everything pulled together at the right moment. And when none of that lines up, the invitation never gets sent.

Here is what we have learned: the moment, the menu, and the setting are not what is most important.

People Remember How You Made Them Feel

Think about the gatherings that have stayed with you. The dinner that stretched past midnight. The summer weekend that everyone still talks about years later. Chances are you remember how the evening felt, not what was served or how the table was set.

Etiquette writer Alison Cheperdak makes this point simply: guests remember how they felt.¹ Whether the host was genuinely glad they came. Whether they left feeling more connected than when they walked in. That is what people carry home.

We often think of wealth in terms of what it allows us to acquire. Just as important is what it allows us to create: time together, shared experiences, stronger relationships, and memories that endure long after the evening is over.

That’s one of the quiet luxuries of having resources—not simply owning more, but having the opportunity to bring the people you care about together.

The Underrated Power of Going First

Your friends who are known for bringing others together rarely provide the most elaborate spreads. They are the ones who actually send the invitation. They think ahead about who in the room might enjoy knowing one another. They make the introduction without waiting to be asked. And they follow up afterward because they genuinely meant it when they said they were glad someone came.²

That is it. No elaborate planning. Just a little initiative and genuine care for the people in the room.

Good news: you do not need the perfect moment. Summer is the perfect excuse. Send the text, pick a date, and do not overthink the rest. Getting everyone together is the whole point and honestly, the hardest part is just deciding to do it. The people who show up will be glad you did.

Creating Space for Relationships

The calendar is full. The logistics are real. It is very easy to let the intention sit there indefinitely. But the gathering itself, even when it is imperfect and improvised, tends to be worth it. The people who show up are not thinking about whether everything came together perfectly. They are thinking about whether they will be invited back.

Summer has a way of creating room for this. Longer evenings. A slower pace. A little more space to actually follow through. So here is our friendly nudge: who have you been meaning to have over, and what has actually been stopping you?

At Crestwood, we believe wealth is ultimately about creating the freedom to live intentionally, to spend more time with the people who matter, strengthen relationships, and make room for the moments you’ll remember long after the details have faded.

That’s the perspective we bring to every planning conversation. If you’re ready to build a financial plan around the life you want to live, we’d welcome the opportunity to talk.


FAQ

What actually makes a gathering memorable?

Guests rarely remember what was served or how the table was set. What stays with people is how they felt: whether the host was genuinely glad they came and whether they left feeling more connected than when they arrived.

What do the best hosts do differently?

They send the invitation before waiting for the perfect moment, think ahead about who might enjoy knowing one another, and follow up afterward. It is less about planning and more about genuine care for the people in the room.

Why does entertaining feel harder than it used to?

Social media has made hospitality feel like a production, raising the bar on what a gathering is supposed to look like. Most people find that once they stop trying to make it perfect, it becomes a lot easier to actually do it.

Sources

¹ Alison Cheperdak, Was It Something I Said?, Chapter 6: “Hosting and Attending: What Matters Most”

² Myka Meier, Modern Etiquette Made Easy, Chapter 5

A New Savings Opportunity for the Next Generation


Trump Accounts are scheduled to begin accepting contributions on July 4th, and a number of clients have already reached out asking whether one is worth opening for their kids or grandkids.

The short version: they’re a genuinely useful addition to the savings landscape, but they’re unlikely to replace the accounts most families already rely on, such as 529 plans, Roth IRAs, and custodial accounts. Here’s what you need to know:

At a Glance

  • Who can open one: Parent or legal guardian of a child under 18 with a Social Security Number
  • Annual contribution limit: $5,000 (after-tax dollars; no upfront tax deduction)
  • Government contribution: $1,000 for children born January 1, 2025 – December 31, 2028
  • How it grows: Tax-deferred (no annual tax on investment gains)
  • When funds can be accessed: Generally age 59½, with limited exceptions
  • What it becomes: Depending on the custodian, it could convert to a traditional IRA at age 18

What Is a Trump Account?

A Trump Account is a new investment account for children, built around one headline feature: a one-time $1,000 contribution from the federal government for children born between 2025 and 2028.

From there, parents, grandparents, friends, and in some cases, employers can add to the balance. Unlike a custodial Roth IRA, a retirement savings account that requires the child to have earned income from a job, anyone can contribute to a Trump Account regardless of whether the child works.

How Do These Accounts Work?

Contributions are capped at $5,000 a year, made with after-tax dollars. The money is meant to stay invested, not spent young. Withdrawal rules work like retirement accounts rather than something like a 529, and when the child turns 18, depending on the custodian, the account could convert automatically into a traditional IRA.

For now, the investment menu is limited to low-cost funds tracking broad U.S. stock indexes like the S&P 500, though more options are expected over time.

 What’s Appealing About Trump Accounts?

For eligible families, the free $1,000 is the easy part of the pitch – it’s money you don’t have to contribute yourself.

Opening an account at or near birth gives savings the benefit of time, allowing decades of tax-deferred growth before the funds are used. It also provides family members with another thoughtful way to contribute to a child’s future, alongside more traditional gifts such as savings bonds or graduation checks.

Where We’d Be Cautious

The tradeoff is that these funds are intended for long-term retirement savings, which can make them less flexible than other savings vehicles.

A few things worth weighing before treating it as more than a supplement:

  • For education costs, a 529 plan remains the best option with tax-free growth and withdrawals for qualified expenses.
  • For a child with earned income, a custodial Roth IRA typically offers more flexibility and a higher contribution ceiling.
  • For goals outside of retirement, a UTMA or UGMA account provides substantial flexibility to withdraw funds before age 18, without the IRA restrictions.

In short: Trump Accounts are built for the long game. If flexibility or education funding is the goal, other vehicles are still the better fit.

Who Should Consider Opening a Trump Account?

This type of account makes the most sense if you:

  • Have a child born between 2025 and 2028, so you qualify for the $1,000 federal contribution.
  • You are already maxing out a 529 plan and want another long-term savings vehicle.
  • You’re a grandparent looking for a more structured alternative giving a cash gift.

Our Take

There are many ways to save for a child’s future, and the right approach depends on your family’s goals and circumstances.

For families with an eligible child or grandchild, the $1,000 federal seed contribution makes a Trump Account worth considering as it’s an opportunity to receive funds that otherwise wouldn’t be available to you.

If you’d like to think through options together, reach out to your Crestwood team.

Contact Us


This document is provided for general informational purposes only by Crestwood Advisors, an investment adviser. Crestwood Advisors does not provide legal advice, and this document should not be construed as containing legal advice. For legal advice, consult with a licensed attorney. This document should not be construed as containing tax advice. For tax advice, consult with your tax adviser. Account rules and features are subject to change as guidance evolves.

Sources:

https://trumpaccounts.gov/
https://www.investor.gov/introduction-investing/investing-basics/investment-accounts/tax-advantaged-accounts/trump-accounts
https://home.treasury.gov/news/press-releases/sb0508

June Economic and Market Update: Hot (Earnings), Hot (Inflation), Hot (Seat for the New Fed Chair)

May delivered strong headline results against a market backdrop defined by competing forces. Corporate earnings accelerated to their best pace since late 2021, supported by technology and ongoing AI infrastructure spending, while mega-cap leadership continued to lift the cap-weighted S&P 500. At the same time, narrow market breadth, persistent inflation, energy price uncertainty, and a Federal Reserve leadership transition created a wider range of possible outcomes for markets.

Strong Earnings and the Rally That Left Half the Market Behind

The first-quarter earnings season closed May in remarkable fashion. After nearly all S&P 500 companies reported, the blended year-over-year earnings growth rate reached 28.6%, the highest since the fourth quarter of 2021.1 Some 85% of companies beat consensus estimates, a rate above the five-year and ten-year averages, and the magnitude of surprise, 16.7% above estimates, was the widest since early 2021.1 The technology sector led all sectors with blended growth of 54.3%, lifted by results from Nvidia, Microsoft, and Dell Technologies. Nvidia alone reported first-quarter revenue of $81.6 billion, an 85% year-over-year increase, and GAAP net income of $58.3 billion, with data center revenue up 92% to a record $75.2 billion.2 The first quarter was, by most traditional measures, one of the strongest in recent memory.

  • AI capex: The Nvidia result crystallized a theme running through every major technology earnings call this season: hyperscaler capital spending has not paused. Meta’s increase to full-year 2026 capital expenditure guidance reinforced a broader trend: hyperscalers continue to spend aggressively on AI infrastructure, with aggregate 2026 capex now estimated near $725 billion. 2 Nvidia CEO Jensen Huang described demand as having “gone parabolic” as agentic AI applications accelerated orders from cloud and sovereign customers alike.
  • The breadth problem: Behind the record index closes, the rally remained narrow through most of May. The S&P 500 reached new highs due to the mega-caps driving gains, while the average stock in the same index, as measured by the equal-weight S&P 500, produced only modest gains. The top ten holdings by weight currently account for roughly 40% of the S&P 500’s total index value, compared to a historical norm of 20 to 25%.3
  • Historical context: The current dominance of the cap-weighted S&P 500 over its equal-weight counterpart has a clear historical precedent: the late-1990s tech bubble when the cap-weighted index outperformed the equal-weighted index by roughly 31% on a 3-year rolling basis.3 More recently, in 2021 the Magnificent Seven gained more than 50% while the broader S&P 500 returned approximately 29%. However, these periods of concentration can reverse quickly: in 2022 the equal-weight index outperformed the Mag 7 by 34 percentage points when the market declined by 18%.3
  • Valuation and guidance: The forward 12-month price-to-earnings ratio for the S&P 500 stands at 21.2, above recent historical averages.1 For the second quarter, roughly equal numbers of S&P 500 companies issued positive and negative EPS guidance, a ratio that is worth monitoring as the back half of 2026 approaches. The market’s reaction to Nvidia’s May earnings release highlights the valuation tension embedded in today’s AI leadership. Despite reporting 85% year-over-year revenue growth, shares fell about 2% the following day. This was perceived as a “sell the news” response to a quarter that beat on every metric, because elevated expectations had raised the bar for what constitutes outperformance.2

Implications for Investors: The earnings picture appears to support stock valuations as the AI infrastructure cycle shows little sign of peaking. The concern is not the cycle itself but the distribution of its rewards. When 40% of the S&P 500’s weight sits in ten names, a stumble in any one of them has a greater impact than it would in a more balanced market. Investors who hold broad index exposure also hold a concentrated bet on continued mega-cap outperformance. The gap between cap-weight and equal-weight returns, now widened for several years running, historically closes, and the closure is rarely gradual. Maintaining exposure to companies outside the leading cluster, whether through non-U.S. large cap funds, sector tilts, or individual positions, may provide some insulation when leadership eventually changes.

A New Fed Chair, Inflation Update, and a Shifting Yield Curve

May delivered three macro events that each on their own would have been remarkable for a given month: the highest CPI reading in three years, the confirmation of a new Federal Reserve chair, and a sharp decline in oil prices.

  • Inflation: On May 12th, the Bureau of Labor Statistics reported that the Consumer Price Index rose 0.6% in April on a seasonally adjusted basis, putting the 12-month rate at 3.8%, the highest since May 2023. Energy accounted for more than 40% of the monthly increase, with gasoline up 28.4% year-over-year and the broader energy index up 17.9%.4 Core inflation, excluding food and energy, rose 0.4% for the month and 2.8% over the year, well above the Federal Reserve’s 2% target.4 Real average hourly wages slipped 0.5% for the month.4
  • The new Fed Chair: The Senate confirmed Kevin Warsh as Federal Reserve Chair in a 54-to-45 vote, the slimmest confirmation margin in the modern Fed era.5 Warsh took office May 15th as Jerome Powell’s term as chair expired. The transition comes at an awkward moment: the April FOMC meeting produced four dissents, the most divided committee since 1992, and the funds rate has been held at 3.50% to 3.75% for three consecutive meetings.5 Futures markets have shifted meaningfully: expectations of rate cuts have been priced out and traders have shifted to speculating about a potential rate hike this year.5
  • Labor market: April payrolls rose 115,000, well above the 55,000 consensus, and the unemployment rate held at 4.3%, marking back-to-back monthly job gains for the first time in more than a year.6 Average hourly earnings rose 3.6% year-over-year, below the 3.8% forecast, a mild positive for the inflation picture.6
  • Oil: Brent crude fell nearly 19% in May as ceasefire extension talks between the U.S. and Iran progressed toward a 60-day memorandum of understanding.7 The WTI oil benchmark fell approximately 16.5% for the month. The decline was welcome, but the situation remains perilous as the Strait of Hormuz remained under restricted conditions pending formal approval of the ceasefire extension.7 The decline in oil prices is likely to benefit near-term CPI readings, but the underlying supply picture remains fragile.
  • Yield curve: The Treasury curve flattened meaningfully in May as markets repriced the Fed’s path. The 2-year yield rose sharply on hike expectations, finishing the month near 4.12%, while the 10-year finished the month at approximately 4.45%, having spiked toward 4.7% mid-month on the CPI announcement before retreating as oil prices fell. The 30-year reached 5.18%, its highest level since 2023, before retreating to finish at 5%.8 The spread between 2-year and 10-year Treasury yields narrowed to roughly 0.33%, well below the 1-1.5% range typical of a healthy expansion, as the front end absorbed the inflation shock faster than the long end.8

Implications for Investors: Core inflation is running nearly a full percentage point above the Fed’s target, and the new chair must establish credibility in his first meeting while managing a divided committee. The bond market appears to be pricing not just near-term inflation worries, but also longer-run uncertainty about the fiscal outlook and the Fed’s policy direction. Even after May’s decline, energy prices remain well above year-ago levels, sustaining upward pressure on inflation and weighing on consumer purchasing power. For equity investors, the macroeconomic picture reinforces the case for companies with pricing power, low refinancing risk, and durable free cash flow, characteristics that hold up across a wider range of rate outcomes than the market has seen in recent years.


The Takeaway

If May had a single lesson, it was that strong aggregate numbers can coexist with significant underlying fragility. Earnings were broadly excellent, yet the market rewarded a fraction of the companies generating them. Inflation persisted at the headline level as oil fell, core prices remained stubborn, and the yield curve flattened in ways that suggest the bond market is not yet convinced the problem is solved. A new Fed chair stepped into one of the most divided committees in a generation. Each of these stories has a constructive resolution available to it. What remains unclear is whether they arrive in the sequence that markets have priced in. Investors willing to stay the course while keeping quality and diversification at the center of their portfolios are, in our view, well positioned for what the second half may bring.


Returns of Market Indices 

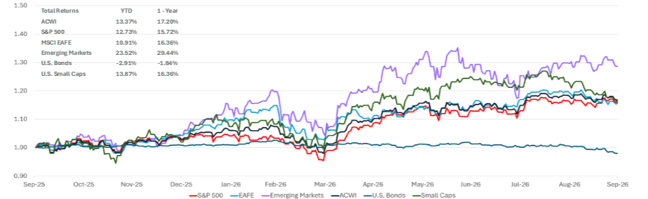
U.S. equities finished May at record levels, with the S&P 500 closing at 7,580, the Dow Jones Industrial Average at 51,032, and the Nasdaq Composite at 26,973, each at an all-time closing high.9 The S&P 500 posted a return of 5.26%, driven by the late-month AI and technology rally following the Nvidia earnings report. Global equity returns were also strong (MSCI ACWI +5.2%). Emerging markets equities, which are particularly sensitive to oil prices, rose dramatically (MSCI EM Equities +9.7%).  International developed-market equities, as measured by the MSCI EAFE Index, underperformed U.S. large caps for the month (+3.2% return).9 U.S. small caps rose as well (Russell 2000 +4.4%). Fixed income was under pressure: the 10-year Treasury yield ended May near 4.45% after spiking toward 4.7% mid-month on the CPI results, and the 30-year Treasury reached 5.18% at its mid-month peak, pressuring the Bloomberg U.S. Aggregate Bond Index for the month, which finished nearly flat (+0.31%).9 YTD Returns are shown in the chart below.


Sources
  1. FactSet Research Systems, “Earnings Insight,” May 29, 2026 (insight.factset.com). Blended Q1 2026 S&P 500 earnings growth rate of 28.6%; 85% of companies beating estimates; aggregate EPS surprise of 16.7%; forward 12-month P/E of 21.2; Information Technology blended growth of 54.3%; 56 companies issuing positive and 46 negative Q2 2026 EPS guidance.
  2. Nvidia Corporation, Q1 FY2027 Earnings Release, May 20, 2026 (nvidianews.nvidia.com). Revenue of $81.6 billion (85% YoY); data center revenue of $75.2 billion (92% YoY); GAAP net income of $58.3 billion (211% YoY); non-GAAP diluted EPS of $1.87. Hyperscaler 2026 capex estimate of approximately $725 billion per CNBC, “Hyperscalers’ AI buildout will require massive amounts of energy,” May 13, 2026 (cnbc.com).
  3. S&P Dow Jones Indices, Equal Weight Sector Dashboard, May 2026 (spglobal.com). Top-10 weight at approximately 40% of S&P 500; historical norm 20-25%; dot-com era rolling outperformance figure of ~31%. Magnificent Seven 2021–2022 relative return data per Bloomberg.
  4. U.S. Bureau of Labor Statistics, “Consumer Price Index — April 2026,” released May 12, 2026 (bls.gov/news.release/archives/cpi_05122026.htm). CPI +0.6% MoM, +3.8% YoY; core CPI +0.4% MoM, +2.8% YoY; energy index +17.9% YoY; gasoline index +28.4% YoY; real average hourly earnings -0.5% MoM.
  5. U.S. Senate Roll Call, May 13, 2026: Kevin Warsh confirmed as Federal Reserve Chair, 54-45 vote. Federal Reserve, FOMC Statement, April 29, 2026; four dissents noted. CNBC, “Kevin Warsh wins Senate confirmation as the next Federal Reserve chair,” May 13, 2026 (cnbc.com). CME FedWatch, May 2026: market-implied probability of a rate hike by December 2026. Federal funds rate target range: 3.50%-3.75%.
  6. U.S. Bureau of Labor Statistics, “Employment Situation — April 2026,” released May 8, 2026 (bls.gov/news.release/empsit.nr0.htm). Nonfarm payrolls +115,000; unemployment 4.3%; average hourly earnings +3.6% YoY.
  7. CNBC, “Oil drops 20% from 2026 peak on optimism over U.S.-Iran ceasefire talks,” May 29, 2026 (cnbc.com). Brent crude down ~19% for May; WTI down ~16.5%. Pending 60-day MOU between U.S. and Iran to extend ceasefire, per CNBC reporting, May 28, 2026.
  8. Federal Reserve H.15 Selected Interest Rates, daily release, May 29, 2026 (federalreserve.gov/releases/h15); data sourced via FRED series DGS2, DGS10, DGS30 (Federal Reserve Bank of St. Louis, fred.stlouisfed.org). Treasury constant maturity yields at month-end: 2-year ~4.12%, 10-year ~4.45%; 30-year mid-month peak ~5.18%, finishing near 5.0%. 2s10s spread (FRED series T10Y2Y) approximately 33 basis points at month-end, vs. 100-150 bp range typical of a healthy expansion. Yield curve flattening driven by front-end repricing on revised Fed expectations; rise in long-end yields attributed to term premium rebuilding.
  9. Bloomberg, index closing levels, May 29, 2026. S&P 500: 7,580.06; Dow Jones Industrial Average: 51,032.46; Nasdaq Composite: 26,972.62. 10-year Treasury yield: approximately 4.45% at month-end; 30-year Treasury yield peak of approximately 5.18% mid-month. MSCI EAFE, MSCI ACWI, MSCI Emerging Markets, Russell 2000, and Bloomberg U.S. Aggregate Bond Index returns: Bloomberg terminal, May 2026.


What Wealth Looks Like When No One Is Watching

Nobody talks about the awkward parts of financial success. 

The adult child who calls asking for help with a down payment, and the parent who isn’t sure whether saying yes is generous or enabling. The entrepreneur sitting in the parking lot after selling the company they spent fifteen years building, feeling hollowed out instead of relieved. The retiree who hit every number, did everything right, and still can’t quite figure out what to do with a Tuesday afternoon. 

These aren’t edge cases. After decades of working with successful individuals and families at Crestwood Advisors, we’d argue they’re closer to the rule. 

Wealth has a public face: the business, the real estate, the career arc. And then it has everything else. The private decisions that don’t make it into the annual review. The family dynamics that no financial plan anticipated. The moments where the money is clearly not the hard part. 

The questions that actually keep people up at night 

The most consequential conversations we have with clients rarely start with a portfolio question. They start with something messier. 

How do we help aging parents without making them feel like they’ve lost control of their own lives? How do we support our kids financially without guaranteeing that they never have to figure things out for themselves? How do we make sure the wealth we’ve spent decades building holds the family together, rather than slowly pulling it apart? 

These questions have real financial dimensions, but they’re not financial questions at their core. Treating them like they are, running straight to the numbers before understanding what’s actually at stake, is one of the more common mistakes we see. 

The thing about success that doesn’t get talked about enough 

Early on, building wealth is mostly about momentum. Grow the business. Advance. Save. Protect your family. The goals are concrete and the metrics are clear. 

At some point, though, the game quietly changes. The scoreboard that made sense for the first half doesn’t tell you much in the second. A lot of successful people reach that moment and realize they haven’t thought much about what comes next, or what any of it was actually for. 

That’s not a failure of planning. It’s just an honest feature of how life unfolds. The problem is that most financial conversations aren’t set up to handle it. 

What we actually mean when we talk about financial freedom 

The phrase gets used constantly, but it usually just means having enough money to stop worrying. That’s not nothing. But the families who handle wealth well tend to think about it more specifically. They treat it as a tool with a particular job: to create options. The ability to step back from work when something more important needs attention, to care for a parent without a financial crisis running in the background, to make decisions from a position of stability rather than pressure, and to be thoughtful about what gets passed on, and how. 

What it actually looks like 

Behind closed doors, the families who’ve built something real tend to look less like a success story and more like people who’ve done the unglamorous work of being honest with each other. They’ve had the uncomfortable conversations about estate plans before a health scare forced the issue. They’ve thought seriously about what they want the next generation to inherit beyond the assets. They’ve sorted out, more or less, the difference between the life they’ve built and the life they want to be living. 

That’s the work. Not just the portfolio optimization or the tax efficiency, though those matter too. 

At Crestwood, our work has never been simply about managing assets. It’s about helping families think more clearly about what they’re building, who they’re building it for, and how their financial life can support the things that actually matter to them. 

Because the most meaningful measure of wealth isn’t what you accumulate. It’s what you do with it. 

If you’re navigating a transition, thinking through a major decision, or simply want to make sure your financial life reflects what actually matters to you, we’d be glad to talk. Contact us to get started. 


FAQ

What does “financial freedom” really mean for successful families?
For most successful families, financial freedom isn’t simply about accumulation. It’s about optionality: the ability to step back from work when life demands it, care for aging parents without financial pressure, and make major decisions from a position of stability rather than urgency. It also includes being intentional about wealth transfer, choosing not just what to pass on, but how and why.

Why do successful people often feel unprepared for major life transitions?
Early in a career, wealth-building has clear metrics: grow revenue, advance, save more. After a business sale, retirement, or other milestone, those metrics no longer apply. Most financial planning doesn’t address the identity and purpose questions that surface in this phase, which is why many high-net-worth individuals find themselves feeling adrift even after achieving everything they planned for.

How should families talk to their financial advisor about non-financial concerns?
Start honestly. If the real question is about a family member, an inheritance dynamic, or a life decision, say so directly. Advisors who reframe every concern as a portfolio problem aren’t equipped to help with what actually matters. The most productive client relationships begin with the messier questions, not the balance sheet.

What are the most common financial mistakes high-net-worth families make?
Bypassing the relational and philosophical work in favor of pure optimization is among the most common. Families often defer estate conversations until a health event forces the issue, fail to articulate what they want the next generation to inherit beyond assets, and make financial decisions around family members without aligning on shared values first. These aren’t investment mistakes. They’re gaps in the harder, more human work.

How does Crestwood Advisors approach wealth management differently?
Crestwood treats wealth as a tool, not a destination. The goal isn’t simply growing and protecting assets; it’s ensuring a client’s financial life is aligned with what actually matters to them. That means making space for the private, complicated questions that don’t surface in a typical annual review, and helping families think clearly about what they’re building and who they’re building it for.

When should a high-net-worth individual or family reach out to a wealth advisor?
Beyond the obvious moments (business sale, inheritance, retirement), the right time is any point where a major decision is on the table and the stakes feel personal, not just financial. Estate conversations, family support decisions, and life transitions are often better addressed before they become urgent. The earlier a trusted advisor is part of those conversations, the more useful they can be.

You Filed Your Taxes. Now What? The Step Most People Skip (But Shouldn’t)

Once April 15 passes, there’s usually a wave of relief. Maybe you got a refund, maybe you owed more than expected. Either way, the instinct is to file tax season away and move on. Before you do, there’s one step worth taking that can make a real difference in your financial life: reviewing your tax return.

It may not sound exciting, but your tax return is full of information that can guide smarter financial decisions throughout the year. Think of it as a snapshot of your financial habits, opportunities, and potential pitfalls.

If you’ve received your 2025 tax return, we invite you to share a copy with us and schedule a review. Together, we can identify strategies to improve tax efficiency and strengthen your financial plan for 2026 and beyond.

Not currently a client? We’d be happy to connect and explore how thoughtful, proactive planning can support your long-term goals.

Start With the Big Numbers

A great place to begin is with your Total Income and Adjusted Gross Income (AGI). For those who aren’t familiar, AGI is your total income minus specific IRS deductions. These two figures influence what credits you qualify for, how much you can contribute to certain retirement accounts, and more. AGI, in particular, appears in dozens of IRS thresholds, and understanding it can help you anticipate how future decisions may affect your taxes.

Next, look at your deductions. Most households take the standard deduction, and for many, that’s the right move. However, if you have significant medical expenses, pay substantial in state and local taxes, or give generously to charity, itemizing your deductions might save you more. Reviewing what you did last year can help you plan for this one. You might consider bunching charitable gifts this year or tracking medical expenses more closely.

Your taxable income is another important figure. This is the amount the IRS ultimately taxes, and it determines your tax bracket. Understanding how it’s calculated helps you see how additional income or deductions might affect your tax bill.

Finally, review your total tax paid. This helps you evaluate whether your withholding or estimated payments were on target, or whether you should adjust them for the coming year.

Your Marginal Rate Isn’t Your Real Rate

A common misconception is that your tax bracket is the rate you pay on all of your income. In reality, the U.S. uses a progressive tax system, meaning your income is taxed in layers. For example, a single filer in 2026 pays 10% on the first portion of income, 12% on the next portion, and so on. You may fall into the 24% bracket, but your effective rate, meaning what you actually pay across all of your income, could be closer to 16%. Understanding this difference can inform decisions around strategies such as realizing capital gains or completing Roth conversions.1

Look at the Types of Taxes You Paid

Another valuable part of your return is the breakdown of the types of taxes you paid. Did most of your tax bill come from ordinary income? Long-term capital gains? Dividends? Net investment income? This matters because different types of income are taxed differently, and knowing where your taxes came from can guide your future planning decisions.

For example, if long-term capital gains made up a big portion of your tax bill, you might explore strategies such as tax-loss harvesting or direct indexing. These strategies can help you offset gains now or in future years, which is especially useful if you expect a large gain down the road. Additionally, since long-term capital gains are taxed at lower rates than ordinary income, understanding how much of your income falls into each category can help you optimize your investment approach.

If You’re on Medicare, MAGI Matters

For Medicare beneficiaries, your Modified Adjusted Gross Income (MAGI) plays a major role in determining your Medicare Part B and Part D premiums. For Medicare purposes, MAGI is generally your AGI plus any tax-exempt interest. Higher MAGI means higher premiums, so managing your income becomes especially important.

This becomes even more relevant once Required Minimum Distributions (RMDs) begin, typically around age 73. RMDs are mandatory withdrawals from pre-tax retirement accounts, and they count as ordinary income. As a result, they can push you into higher Medicare brackets whether you want them to or not.

If you’re charitably inclined, Qualified Charitable Distributions (QCDs) can be a powerful tool. A QCD allows you to send money directly from your IRA to a charity. The amount counts toward your RMD but doesn’t show up as income on your tax return, which may help keep your Medicare premiums lower. In 2026, you can contribute up to $111,000 in QCDs per person, or $222,000 for a married couple where both spouses are 70½ or older and have their own IRAs.

Standard vs. Itemized Deduction

For the 2025 tax year, the standard deduction ranged from $15,750 for single filers to $31,500 for married couples filing jointly, with heads of household falling in between. As you review your 2025 return and plan ahead for 2026, it is also helpful to note that the standard deduction will increase to $16,100 for single filers, $24,150 for heads of household, and $32,200 for married couples filing jointly.2

You can either take the standard deduction or itemize deductions on Schedule A, depending on which provides the greater benefit. Itemized deductions may include medical expenses, state and local taxes, mortgage interest, and charitable contributions.

Two new considerations under the One Big Beautiful Bill Act (OBBBA) are worth noting. First, a 0.5% AGI floor now applies to charitable contributions for all itemizers, meaning only the portion of your giving above 0.5% of AGI is deductible. Second, taxpayers in the top 37% bracket see the tax benefit of their itemized deductions capped at 35 cents on the dollar. If your itemizable expenses are within striking distance of the standard deduction, bunching charitable gifts or medical procedures into a single year can tip the math in your favor.

Why This Review Is Worth Your Time

Your tax return is more than a form you file once a year. It’s a roadmap that connects directly to your investment strategy, retirement planning, estate planning, charitable giving, and even healthcare costs. Once you start looking at your return through a holistic planning lens, you’ll see how interconnected these areas are. A thoughtful review can uncover opportunities, help you avoid surprises, and ultimately keep more of your money working for you.

Whether you have questions about your recent return or want to explore these planning strategies further, your Crestwood team is here to help. If you are not currently a client, we welcome the opportunity to connect and discuss how thoughtful planning can support your long-term goals, contact us.

 
This document is provided for general informational purposes only by Crestwood Advisors, an investment adviser. Crestwood Advisors does not provide legal advice, and this document should not be construed as containing legal advice. For legal advice, consult with a licensed attorney. This document should not be construed as containing tax advice. For tax advice, consult with your tax adviser.
Source 1: IRS.gov, Federal income tax rates and brackets | Internal Revenue Service, (last accessed May 2026).
Source 2: IRS.gov, Credits and deductions for individuals | Internal Revenue Service, (last accessed May 2026).