Q2 Earnings Wrap: A Very Strong Quarter, With a Very Familiar Caveat
The Q2 earnings season closed with the S&P 500 posting a blended year-over-year earnings growth rate of 52%, the highest quarterly reading since Q4 2020.1 Revenue grew 15.5%, the fastest pace since Q4 2021, while the 17% net profit margin was the highest FactSet has ever recorded for a full quarter.
- The concentration story is now more measurable than ever: Alphabet’s Q2 earnings included a $98 billion mark-to-market gain on equity securities driven primarily by its stakes in SpaceX and Anthropic. Amazon’s GAAP earnings included a separate $53.4 billion gain on equity securities, primarily its investment in Anthropic. Excluding Alphabet alone, the blended growth rate falls from 52% to 40.6%. Excluding both, it falls to 33.8%. The gains are real accounting entries even though no shares changed hands.1
- The Hearty 493: The Magnificent Seven reported blended earnings growth of 118.5% for Q2, the highest since Q4 2020. An equally noteworthy figure is the other 493 companies in the index grew earnings at 31.8%.1
- Guidance for the back half remains strong: Analysts expect double-digit growth to continue and currently project Q3 2026 earnings growth of 28.2% and Q4 growth of 25.8%. Full-year 2026 earnings are projected to grow 31.2%, with 2027 projected at 14.4%. The forward 12-month P/E ratio stands at 19.6, below the 5-year average of 19.9 but above the 10-year average of 19.0.1
Implications for Investors: Q2 earnings results were enormous. While Q2 results for Magnificent 7 were outsized, the earnings growth excluding those stocks is a healthy signal that strength is not confined to a handful of mega-cap tech stocks.
The Warsh Fed Signals It Is More Willing to Hike Than to Cut
On August 28, Chair Warsh delivered his first Jackson Hole address, marking his 100th day at the Federal Reserve.2 The speech, titled “In Our Time,” walked through his approach to monetary policy and closed with a section on current conditions. In that closing section, Chair Warsh said, “I would be hard pressed to describe broad financial conditions as restrictive.”2 He added that while summer inflation readings were better than expected, they “do not tell me that underlying inflation trends have meaningfully improved.”2 He restated the 2% PCE inflation target as a firm objective and observed that “price stability is not self-executing, nor is inflation necessarily mean-reverting.”2 Markets took the address as leaning toward higher rates for longer. The 30-year Treasury yield closed the following week at approximately 5.25%, near multi-decade highs, and bond markets began pricing higher rates as a more likely probability.
Three regional Fed presidents are now publicly advocating for a hike: Cleveland’s Beth Hammack, Minneapolis’s Neel Kashkari, and Dallas’s Lorie Logan each dissented at the July 29 meeting in favor of a 0.25% hike, and each has since made the case publicly. Hammack said, “Now is the time for the FOMC to act to speed the return of PCE inflation to our 2% objective.”3 Kashkari argued for a series of small hikes rather than waiting: “A potential series of small policy moves would be better than waiting and eventually concluding that even bolder actions were necessary.”4 Logan said, “Without any policy restraint, inflation will likely continue to trend above target until there is an unanticipated shock,” adding that “the FOMC cannot count on unanticipated shocks to achieve its goals.”3 Richmond Fed President Tom Barkin called the case for adding restraint “a strong case.”3
Other Macro Developments
- July payrolls fell for the first time in the cycle: The Bureau of Labor Statistics reported that nonfarm payrolls declined by 23,000 in July, well below a consensus estimate for an 83,000 gain.5 May and June payrolls were also revised sharply lower. The two months combined were 103,000 lower than previously reported. The unemployment rate ticked down to 4.1% from 4.2%, though the decline was driven by lower labor force participation rather than employment strength.5
- Inflation split by measure in July: The BLS reported on August 12 that July headline CPI rose 0.1% month-over-month and 3.4% year-over-year, cooler than June’s 3.5% year-over-year figure.6 Two weeks later July PCE, the Fed’s preferred inflation gauge, showed the opposite pattern: core PCE rose 0.2% month-over-month with the year-over-year rate unchanged at 3.3%.7 Core PCE has now been in the range of 3.3% to 3.4% for four consecutive months. This is the reading Chair Warsh referenced when he said that summer inflation data did not indicate meaningful improvement in underlying trends.7
- Oil returned to the top of the risk ledger: Brent crude closed August above $90 per barrel following renewed U.S. and Iran hostilities that culminated in a U.S. strike on Iranian mine positions at Larak Island on August 30.8 Energy inflation was a modest driver of the July CPI data improving, since gasoline prices fell during the month, but the August oil rally is very likely to reverse that effect.8
Implications for Investors: The FOMC now faces a policy choice where each side of the dual mandate – maximum employment and price stability – is pulling in opposite directions. Chair Warsh’s Jackson Hole address materially raised the probability that the next rate move is a hike rather than a cut, and market pricing shifted accordingly during the final week of August. With labor market conditions beginning to soften while core inflation remains elevated and rising oil prices present another inflation risk, uncertainty around the Fed’s next move is likely to persist. Longer-term bonds have already repriced to reflect higher interest rate expectations, strengthening the case for favoring shorter maturity and higher quality bonds.
The Cost of Waiting Has Two Sides
Behind every FOMC decision to hold rates steady is a judgment about which mistake is more costly: cutting too early and letting inflation reaccelerate or waiting too long and allowing the labor market to weaken further.
The record from the past sixty years suggests the character of the mistake depends heavily on which data the Fed anchors to at the moment of decision.
- The Burns Fed cut too early and paid for it for a decade: The most cited cautionary tale, and the one Kashkari’s dissent explicitly invoked, is the Burns Federal Reserve of the 1970s. Chairman Arthur Burns raised rates in 1972 to 1974 as inflation climbed above 6%, then reversed course and cut in 1975 as the economy fell into recession following the first oil shock. Inflation, which had briefly fallen below 5%, rebounded sharply and reached above 11% by 1979.9 Volcker, who took the chair in August 1979, ultimately had to push the federal funds rate to a peak of 20% in June 1981 to break the wage-price expectation loop that had become entrenched with Burns. The direct cost was a double-dip recession in 1980 and 1981 to 1982, with unemployment reaching 10.8% in November 1982. The lesson, cited in Kashkari’s public statement, is that a Fed which cuts too early to protect employment can be forced to raise more late9
- The Bernanke Fed of 2007 to 2008 waited to cut and paid a different price: After raising rates 17 times from 2004-2006, the Fed held them at 5.25% into 2007, despite mounting stress in mortgage markets.10 The first cut came in September 2007, and by the time the Fed had cut aggressively into early 2008, the credit crisis had already advanced. The Fed paused from April to October 2008 amid inflation concerns, only to be forced back into aggressive cuts as the global financial crisis deepened. Peak-to-trough employment losses reached 8.7 million by early 2010, and unemployment reached 10% in October 2009. The 2008 pause is regarded by many economists as an example of a Fed that mistook a temporary energy-price spike for a durable inflation problem and paid for that mistake with a deeper recession than was necessary.10
- Greenspan in 1994 to 1995 achieved the only clean soft landing: The lone example of a Fed that navigated a similar policy tension without a recession is the Greenspan Federal Reserve of 1994 to 1995. Chairman Alan Greenspan raised the federal funds rate from 3% to 6% between February 1994 and February 1995 to head off an incipient inflation acceleration, then paused for six months as data softened, then cut only 0.75% over the balance of 1995 and 1996 as inflation stayed contained and the labor market held. The 1994 to 1995 sequence remains the only clear soft landing in the post-1980 record; every other easing cycle in the modern era has either preceded or coincided with a recession.11 Two features made it possible: inflation expectations remained anchored throughout, and the Fed acted before the labor market had begun to visibly weaken. The current environment lacks the first condition and is closer to a live test of the second.11
Implications for Investors: History highlights that both errors, cutting too early and waiting too long, carry real costs. Economic turning points are difficult to identify in real time, which can leave monetary policy too restrictive even as growth and labor market conditions begin to weaken. That risk is particularly relevant today, as the Fed weighs persistent inflation against emerging signs of softer employment while considering whether rates need to remain elevated or move higher.
The historical lesson implication for bond holders is that neither an aggressive tilt to long duration (betting on a future where rapid cuts occur at some point) nor an aggressive tilt to short duration (betting on hikes) is likely to be well rewarded from here. The prudent strategy is to align duration with an investor’s goals while favoring high quality and both geographic and industry diversification. This reduces exposure to any single central bank error.
In both equities and fixed income markets, investors should remain diversified and expect bouts of volatility as it is impossible to predict exactly when the Fed may choose to hike. For investors positioned for distributions, earmarking a portion of their fixed income allocation to short maturity bonds will help buffer some of this unpredictability and price movement.
Returns of Market Indices | August 2026
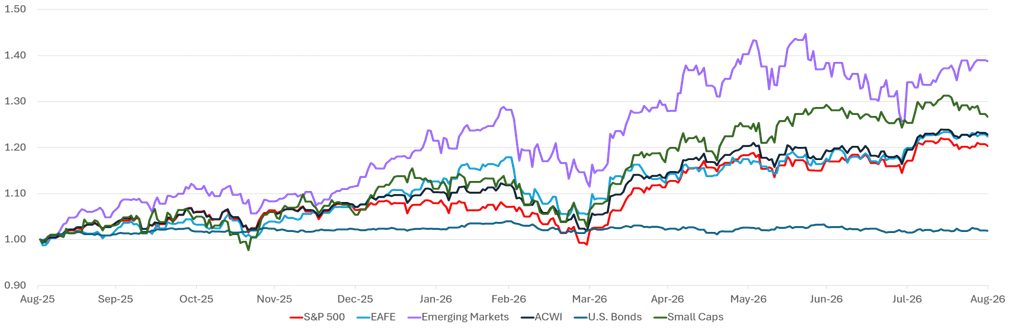
Equities rebounded in August on the heels of volatile July markets. Global Equities (MSCI ACWI) and U.S. Large Caps (S&P 500) rose by 2.7%. U.S. Small caps (Russell 2000) posted a smaller gain of 1% for the month. Developed International Equities (MSCI EAFE) and Emerging Market Equities (MSCI EM Equity) posted gains of 2% and 3.5% respectively. Fixed income (Bloomberg US Aggregate) sold off but finished slightly positive (0.4%) as long-term yields rose to their highest levels since 2007.
Source: Bloomberg. EAFE is MSCI EAFE Index(1), Emerging Markets is MSCI Emerging Markets(2) and U.S. Bonds is Barclays U.S. Aggregate(3). ACWI is the MSCI ACWI Index(4). Small Caps is the Russell 2000 Index(5). S&P 500 is the S&P 500 Index(6).The above information is as of 8/31/2026. Past performance is not indicative of future results.
Sources
- FactSet Earnings Insight, S&P 500 Earnings Season Update: August 28, 2026, John Butters (factset.com). Blended Q2 2026 earnings growth rate 52.0%; excluding Alphabet, 40.6%; excluding Alphabet and Amazon.com, 33.8%. Revenue growth 15.5% (highest since Q4 2021). Net profit margin 17.0% (record). Magnificent Seven Q2 earnings growth 118.5% (highest since Q4 2020); other 493 companies 31.8%. Forward 12-month P/E ratio 19.6. Analyst projections: Q3 2026 EPS growth 28.2%; Q4 25.8%; CY 2026 31.2%; CY 2027 14.4%. Alphabet Q2 GAAP EPS included $98 billion gain on equity securities, primarily related to unrealized gains in equity securities portfolio from SpaceX and a private company (Anthropic). Amazon Q2 GAAP EPS included $53.4 billion other income primarily due to investments in Anthropic.
- Federal Reserve, “Keynote remarks by Chairman Warsh at the 2026 Jackson Hole Economic Policy Symposium,” August 28, 2026 (federalreserve.gov/newsevents/speech/warsh20260828a.htm). Address titled “In Our Time.” Direct quotations: “I would be hard pressed to describe broad financial conditions as restrictive.” “This summer’s inflation readings were better than expected, [but] they do not tell me that underlying inflation trends have meaningfully improved.” “Price stability is not self-executing, nor is inflation necessarily mean-reverting.” Chair Warsh marked his 100th day in office at the address.
- CNBC, “Fed officials who voted to hike rates say action is needed now against inflation,” July 31, 2026 (cnbc.com). AOL/Reuters, “Fed dissenters sketch the case for a rate hike,” July 31, 2026. Direct statements from Cleveland Fed President Beth Hammack, Dallas Fed President Lorie Logan, and Richmond Fed President Tom Barkin as cited. Hammack: “Now is the time for the [Federal Open Market Committee] to act to speed the return of PCE inflation to our 2 percent objective.” Logan: “Without any policy restraint, inflation will likely continue to trend above target until there’s an unanticipated shock.” Barkin: “a strong case” for adding restraint (Wall Street Journal interview cited in CNBC).
- CNBC, “Fed’s Kashkari says ‘now is the time to start slowly moving’ rates up,” August 5, 2026 (cnbc.com/2026/08/05). Direct quotation from Minneapolis Fed President Neel Kashkari: “A potential series of small policy moves would be better than waiting and eventually concluding that even bolder actions were necessary.” “I would rather get going now in small steps than wait till later, then we have a really entrenched inflation problem and have to raise rates aggressively.”
- U.S. Bureau of Labor Statistics, Employment Situation Summary, July 2026, released August 7, 2026 (bls.gov). Nonfarm payrolls declined 23,000 in July 2026 versus consensus estimate of +83,000. May revised down 66,000 to +63,000; June revised down 37,000 to +20,000. Unemployment rate 4.1% (down from 4.2%). Labor force participation rate declined. Average hourly earnings +0.1% month-over-month, +3.2% year-over-year (lowest annual wage growth reading since May 2021).
- U.S. Bureau of Labor Statistics, Consumer Price Index Summary, July 2026, released August 12, 2026 (bls.gov). Headline CPI +0.1% month-over-month, +3.4% year-over-year (down from +3.5% in June). Core CPI +0.2% month-over-month, +2.5% year-over-year. Gasoline component -2.9% month-over-month. Shelter contributed approximately two-thirds of monthly headline increase.
- U.S. Bureau of Economic Analysis, Personal Income and Outlays: July 2026, released August 26, 2026 (bea.gov). Headline PCE +0.2% month-over-month, +3.7% year-over-year (unchanged from June). Core PCE +0.2% month-over-month, +3.3% year-over-year (unchanged from June). Personal income +0.4% month-over-month, personal spending +0.2% month-over-month. Core PCE year-over-year has remained in the 3.3% to 3.4% range for four consecutive months (April 3.3%, May 3.4%, June 3.3%, July 3.3%).
- International Energy Agency, Oil Market Report, August 2026 (iea.org). Brent (North Sea Dated) rose approximately $25.67 per barrel during July 2026 to close the month at approximately $96.80 per barrel. Intra-month high of approximately $105 per barrel on July 23, 2026. August-end price above $90 per barrel following renewed U.S. and Iran hostilities and the reported U.S. strike on Iranian mine positions at Larak Island on August 30, 2026 (as reported by Reuters and Wall Street Journal).
- Richmond Fed Economic Brief 16-11, “The Burns Disinflation of 1974” (richmondfed.org). Reed College Economics Department, “Disinflation in 1979-82 Case” (reed.edu/economics). Federal funds rate reached peak of 20% in June 1981 under Chairman Paul Volcker. Unemployment rate peaked at 10.8% in November 1982. CPI inflation rose from approximately 3.2% at end of 1972 to above 11% by 1975 during Chairman Arthur Burns’s tenure, then declined and rose again to above 13% by 1980. The 1972 to 1975 sequence of rate increases followed by cuts is the primary “stop-go” precedent cited in modern hawkish arguments.
- Bankrate, “Federal Funds Rate History: 1980 Through the Present” (bankrate.com); Forbes Advisor, “Federal Funds Rate History 1990 to 2026” (forbes.com/advisor). Federal Reserve raised federal funds rate seventeen consecutive times between June 2004 and June 2006, from 1.00% to 5.25%. First rate cut of the 2007 to 2008 easing cycle was announced September 18, 2007. Fed paused between April 2008 and October 2008 before resuming aggressive cuts as the global financial crisis intensified. Peak-to-trough nonfarm payroll losses in the 2007 to 2009 recession totaled approximately 8.7 million (BLS). Unemployment rate reached cycle peak of 10.0% in October 2009 (BLS).
- CFA Institute Enterprising Investor, “When the Fed Cuts: Lessons from Past Cycles for Investors,” September 17, 2025 (blogs.cfainstitute.org). Federal Reserve Bank of St. Louis On the Economy blog, “The Dual Mandate in Conflict: Balancing Current Tensions between Inflation and Employment,” March 2026 (stlouisfed.org). Greenspan Federal Reserve raised federal funds rate from 3.00% in February 1994 to 6.00% in February 1995, paused approximately six months, then reduced by 75 basis points over the balance of 1995 and 1996. The 1994 to 1995 sequence is the only case in the post-1980 record where a substantial rate increase was followed by a soft landing with no ensuing recession.