What Wealth Looks Like When No One Is Watching

Nobody talks about the awkward parts of financial success. 

The adult child who calls asking for help with a down payment, and the parent who isn’t sure whether saying yes is generous or enabling. The entrepreneur sitting in the parking lot after selling the company they spent fifteen years building, feeling hollowed out instead of relieved. The retiree who hit every number, did everything right, and still can’t quite figure out what to do with a Tuesday afternoon. 

These aren’t edge cases. After decades of working with successful individuals and families at Crestwood Advisors, we’d argue they’re closer to the rule. 

Wealth has a public face: the business, the real estate, the career arc. And then it has everything else. The private decisions that don’t make it into the annual review. The family dynamics that no financial plan anticipated. The moments where the money is clearly not the hard part. 

The questions that actually keep people up at night 

The most consequential conversations we have with clients rarely start with a portfolio question. They start with something messier. 

How do we help aging parents without making them feel like they’ve lost control of their own lives? How do we support our kids financially without guaranteeing that they never have to figure things out for themselves? How do we make sure the wealth we’ve spent decades building holds the family together, rather than slowly pulling it apart? 

These questions have real financial dimensions, but they’re not financial questions at their core. Treating them like they are, running straight to the numbers before understanding what’s actually at stake, is one of the more common mistakes we see. 

The thing about success that doesn’t get talked about enough 

Early on, building wealth is mostly about momentum. Grow the business. Advance. Save. Protect your family. The goals are concrete and the metrics are clear. 

At some point, though, the game quietly changes. The scoreboard that made sense for the first half doesn’t tell you much in the second. A lot of successful people reach that moment and realize they haven’t thought much about what comes next, or what any of it was actually for. 

That’s not a failure of planning. It’s just an honest feature of how life unfolds. The problem is that most financial conversations aren’t set up to handle it. 

What we actually mean when we talk about financial freedom 

The phrase gets used constantly, but it usually just means having enough money to stop worrying. That’s not nothing. But the families who handle wealth well tend to think about it more specifically. They treat it as a tool with a particular job: to create options. The ability to step back from work when something more important needs attention, to care for a parent without a financial crisis running in the background, to make decisions from a position of stability rather than pressure, and to be thoughtful about what gets passed on, and how. 

What it actually looks like 

Behind closed doors, the families who’ve built something real tend to look less like a success story and more like people who’ve done the unglamorous work of being honest with each other. They’ve had the uncomfortable conversations about estate plans before a health scare forced the issue. They’ve thought seriously about what they want the next generation to inherit beyond the assets. They’ve sorted out, more or less, the difference between the life they’ve built and the life they want to be living. 

That’s the work. Not just the portfolio optimization or the tax efficiency, though those matter too. 

At Crestwood, our work has never been simply about managing assets. It’s about helping families think more clearly about what they’re building, who they’re building it for, and how their financial life can support the things that actually matter to them. 

Because the most meaningful measure of wealth isn’t what you accumulate. It’s what you do with it. 

If you’re navigating a transition, thinking through a major decision, or simply want to make sure your financial life reflects what actually matters to you, we’d be glad to talk. Contact us to get started. 


FAQ

What does “financial freedom” really mean for successful families?
For most successful families, financial freedom isn’t simply about accumulation. It’s about optionality: the ability to step back from work when life demands it, care for aging parents without financial pressure, and make major decisions from a position of stability rather than urgency. It also includes being intentional about wealth transfer, choosing not just what to pass on, but how and why.

Why do successful people often feel unprepared for major life transitions?
Early in a career, wealth-building has clear metrics: grow revenue, advance, save more. After a business sale, retirement, or other milestone, those metrics no longer apply. Most financial planning doesn’t address the identity and purpose questions that surface in this phase, which is why many high-net-worth individuals find themselves feeling adrift even after achieving everything they planned for.

How should families talk to their financial advisor about non-financial concerns?
Start honestly. If the real question is about a family member, an inheritance dynamic, or a life decision, say so directly. Advisors who reframe every concern as a portfolio problem aren’t equipped to help with what actually matters. The most productive client relationships begin with the messier questions, not the balance sheet.

What are the most common financial mistakes high-net-worth families make?
Bypassing the relational and philosophical work in favor of pure optimization is among the most common. Families often defer estate conversations until a health event forces the issue, fail to articulate what they want the next generation to inherit beyond assets, and make financial decisions around family members without aligning on shared values first. These aren’t investment mistakes. They’re gaps in the harder, more human work.

How does Crestwood Advisors approach wealth management differently?
Crestwood treats wealth as a tool, not a destination. The goal isn’t simply growing and protecting assets; it’s ensuring a client’s financial life is aligned with what actually matters to them. That means making space for the private, complicated questions that don’t surface in a typical annual review, and helping families think clearly about what they’re building and who they’re building it for.

When should a high-net-worth individual or family reach out to a wealth advisor?
Beyond the obvious moments (business sale, inheritance, retirement), the right time is any point where a major decision is on the table and the stakes feel personal, not just financial. Estate conversations, family support decisions, and life transitions are often better addressed before they become urgent. The earlier a trusted advisor is part of those conversations, the more useful they can be.

You Filed Your Taxes. Now What? The Step Most People Skip (But Shouldn’t)

Once April 15 passes, there’s usually a wave of relief. Maybe you got a refund, maybe you owed more than expected. Either way, the instinct is to file tax season away and move on. Before you do, there’s one step worth taking that can make a real difference in your financial life: reviewing your tax return.

It may not sound exciting, but your tax return is full of information that can guide smarter financial decisions throughout the year. Think of it as a snapshot of your financial habits, opportunities, and potential pitfalls.

If you’ve received your 2025 tax return, we invite you to share a copy with us and schedule a review. Together, we can identify strategies to improve tax efficiency and strengthen your financial plan for 2026 and beyond.

Not currently a client? We’d be happy to connect and explore how thoughtful, proactive planning can support your long-term goals.

Start With the Big Numbers

A great place to begin is with your Total Income and Adjusted Gross Income (AGI). For those who aren’t familiar, AGI is your total income minus specific IRS deductions. These two figures influence what credits you qualify for, how much you can contribute to certain retirement accounts, and more. AGI, in particular, appears in dozens of IRS thresholds, and understanding it can help you anticipate how future decisions may affect your taxes.

Next, look at your deductions. Most households take the standard deduction, and for many, that’s the right move. However, if you have significant medical expenses, pay substantial in state and local taxes, or give generously to charity, itemizing your deductions might save you more. Reviewing what you did last year can help you plan for this one. You might consider bunching charitable gifts this year or tracking medical expenses more closely.

Your taxable income is another important figure. This is the amount the IRS ultimately taxes, and it determines your tax bracket. Understanding how it’s calculated helps you see how additional income or deductions might affect your tax bill.

Finally, review your total tax paid. This helps you evaluate whether your withholding or estimated payments were on target, or whether you should adjust them for the coming year.

Your Marginal Rate Isn’t Your Real Rate

A common misconception is that your tax bracket is the rate you pay on all of your income. In reality, the U.S. uses a progressive tax system, meaning your income is taxed in layers. For example, a single filer in 2026 pays 10% on the first portion of income, 12% on the next portion, and so on. You may fall into the 24% bracket, but your effective rate, meaning what you actually pay across all of your income, could be closer to 16%. Understanding this difference can inform decisions around strategies such as realizing capital gains or completing Roth conversions.1

Look at the Types of Taxes You Paid

Another valuable part of your return is the breakdown of the types of taxes you paid. Did most of your tax bill come from ordinary income? Long-term capital gains? Dividends? Net investment income? This matters because different types of income are taxed differently, and knowing where your taxes came from can guide your future planning decisions.

For example, if long-term capital gains made up a big portion of your tax bill, you might explore strategies such as tax-loss harvesting or direct indexing. These strategies can help you offset gains now or in future years, which is especially useful if you expect a large gain down the road. Additionally, since long-term capital gains are taxed at lower rates than ordinary income, understanding how much of your income falls into each category can help you optimize your investment approach.

If You’re on Medicare, MAGI Matters

For Medicare beneficiaries, your Modified Adjusted Gross Income (MAGI) plays a major role in determining your Medicare Part B and Part D premiums. For Medicare purposes, MAGI is generally your AGI plus any tax-exempt interest. Higher MAGI means higher premiums, so managing your income becomes especially important.

This becomes even more relevant once Required Minimum Distributions (RMDs) begin, typically around age 73. RMDs are mandatory withdrawals from pre-tax retirement accounts, and they count as ordinary income. As a result, they can push you into higher Medicare brackets whether you want them to or not.

If you’re charitably inclined, Qualified Charitable Distributions (QCDs) can be a powerful tool. A QCD allows you to send money directly from your IRA to a charity. The amount counts toward your RMD but doesn’t show up as income on your tax return, which may help keep your Medicare premiums lower. In 2026, you can contribute up to $111,000 in QCDs per person, or $222,000 for a married couple where both spouses are 70½ or older and have their own IRAs.

Standard vs. Itemized Deduction

For the 2025 tax year, the standard deduction ranged from $15,750 for single filers to $31,500 for married couples filing jointly, with heads of household falling in between. As you review your 2025 return and plan ahead for 2026, it is also helpful to note that the standard deduction will increase to $16,100 for single filers, $24,150 for heads of household, and $32,200 for married couples filing jointly.2

You can either take the standard deduction or itemize deductions on Schedule A, depending on which provides the greater benefit. Itemized deductions may include medical expenses, state and local taxes, mortgage interest, and charitable contributions.

Two new considerations under the One Big Beautiful Bill Act (OBBBA) are worth noting. First, a 0.5% AGI floor now applies to charitable contributions for all itemizers, meaning only the portion of your giving above 0.5% of AGI is deductible. Second, taxpayers in the top 37% bracket see the tax benefit of their itemized deductions capped at 35 cents on the dollar. If your itemizable expenses are within striking distance of the standard deduction, bunching charitable gifts or medical procedures into a single year can tip the math in your favor.

Why This Review Is Worth Your Time

Your tax return is more than a form you file once a year. It’s a roadmap that connects directly to your investment strategy, retirement planning, estate planning, charitable giving, and even healthcare costs. Once you start looking at your return through a holistic planning lens, you’ll see how interconnected these areas are. A thoughtful review can uncover opportunities, help you avoid surprises, and ultimately keep more of your money working for you.

Whether you have questions about your recent return or want to explore these planning strategies further, your Crestwood team is here to help. If you are not currently a client, we welcome the opportunity to connect and discuss how thoughtful planning can support your long-term goals, contact us.

 
This document is provided for general informational purposes only by Crestwood Advisors, an investment adviser. Crestwood Advisors does not provide legal advice, and this document should not be construed as containing legal advice. For legal advice, consult with a licensed attorney. This document should not be construed as containing tax advice. For tax advice, consult with your tax adviser.
Source 1: IRS.gov, Federal income tax rates and brackets | Internal Revenue Service, (last accessed May 2026).
Source 2: IRS.gov, Credits and deductions for individuals | Internal Revenue Service, (last accessed May 2026).
 

May 2026 Economic and Market Update: New Highs and Old Risks

April delivered the mirror image of March. The S&P 500 closed the month at a fresh all-time high of 7,209, posting its strongest monthly gain since 2020, with the Nasdaq also setting record closes. The rally happened against a backdrop that, on paper, looked unchanged: Brent crude finished the month near $120 per barrel, the U.S. naval blockade of Iran was extended indefinitely, and the Federal Reserve held rates steady while warning that inflation risks remain elevated.

Earnings Did the Heavy Lifting

With approximately one-third of S&P 500 companies reported by month-end, Q1 earnings season has materially exceeded expectations. The blended year-over-year earnings growth rate stood at 15.1% as of late April, up from 13.1% expected at the end of March, putting the index on track for a sixth consecutive quarter of double-digit earnings growth.1 The strength has been broad and quantifiable, not concentrated in a handful of headline names. Eighty-four percent of reporting companies have beaten EPS estimates, with the magnitude of the beats averaging 12.3%, well above the five-year average of 7.3%.1

  • Profit margins reached a new record: The blended net profit margin for the S&P 500 in Q1 2026 stood at 13.4% as of late April, the highest level recorded since FactSet began tracking the metric in 2009, surpassing the prior record of 13.2% set in Q4 2025. Margin expansion was concentrated in the Information Technology sector, which posted a Q1 net margin of 29.1%, up from 25.4% a year earlier. The implication is straightforward: the corporate earnings power that markets are pricing is not a forecast or a forward-looking estimate, it is showing up in actual reported results.1
  • Megacap divergence on AI capital spending: The market’s reaction to megacap technology earnings revealed a meaningful new differentiation. The pattern signals a shift: investors are now pricing AI capital spending against evidence of returns, not on the size of the commitment alone. Alphabet rose approximately 34% in April, its strongest monthly gain since 2004, on a Q1 beat across cloud, advertising, and Waymo. Meta Platforms fell roughly 9% after raising 2026 capital expenditure guidance to a range of $125 billion to $145 billion, even as it beat on earnings. Microsoft fell approximately 4% on its results.2
  • The valuation tension is real: The forward 12-month price-to-earnings ratio for the S&P 500 stood at 20.9 by late April, above both the five-year average of 19.9 and the ten-year average of 18.9, and well above the 19.7 level recorded at the end of March. Current valuations are down from recent peaks. Strong earnings have closed part of the valuation gap, but the index is still being priced for a continuation of the current trajectory through the second half of 2026.1 3

Implications for Investors: Q1 earnings season has provided substantive validation of the fundamental case for U.S. equities, particularly in the technology and industrial sectors. The strength is genuine and broad-based. At the same time, valuations now embed an expectation that the trajectory continues, and the market’s selective reaction to Big Tech capital spending plans suggests investors are no longer giving open-ended credit for AI investment without evidence of return. Investors should recognize that the earnings story does help justify current prices, while remaining mindful that any deceleration in the back half of 2026 will be less forgiving at 20.9 times forward earnings than it would have been at 18 times.

The Macro Picture Remains Cloudy

The market narrative through April was that the Iran conflict was de-escalating, but the actual situation by month-end was more complicated. A U.S.-Iran ceasefire was announced on April 7 and 8, and on April 17 Iran’s foreign minister declared the Strait of Hormuz open during the truce, prompting an 11% one-day decline in oil prices.4 Within ten days, however, the diplomatic picture had reversed. The administration declined Iran’s proposal to reopen the strait permanently, the U.S. naval blockade of Iranian ports was extended indefinitely, and reports indicated that the U.S. Central Command had prepared plans for additional strikes if negotiations stalled.4

  • Oil prices remain elevated and volatile: Brent crude closed near $120 per barrel, up roughly 50% from pre-conflict levels. The April Federal Reserve meeting statement explicitly cited the energy shock as a source of continued inflation risk, and the ISM manufacturing prices index reached 84.6 in April, its highest level since April 2022, on tariff and energy cost pressures.4 5 6
  • Demand destruction has begun in Asia: The International Energy Agency revised its 2026 global oil demand forecast in its April Oil Market Report, projecting a Q2 2026 contraction of roughly 1.5 million barrels per day, which would represent the sharpest decline since the COVID-19 pandemic. The revisions are concentrated in the Middle East and Asia Pacific markets. The IEA noted that demand destruction tends to spread when energy scarcity persists, suggesting downside risks to the global growth outlook beyond the immediate supply story.7
  • The diplomatic standoff structure has hardened: The conflict has reached an unusual state in which the formal ceasefire holds but the economic standoff continues. Iran has retained the ability to selectively close or condition traffic through the Strait, the U.S. is maintaining a naval blockade of Iranian ports, and the underlying disputes remain unresolved.4
  • GDP bounced back from a shutdown-driven slowdown: Real GDP grew at an annualized rate of 2.0% in Q1 2026, according to the BEA’s advance estimate. This was a meaningful acceleration from Q4 2025’s 0.5%. The Q4 slowdown was largely attributable to the 43-day government shutdown. The Q1 rebound was driven by a resumption of government spending and exports, with federal employee compensation snapping back as operations returned to normal.8
  • Labor markets remained relatively steady, with unemployment at 4.3%: Employers added 178,000 nonfarm payroll jobs in March, a strong recovery from a significant decline in February (-133,000) that was attributed in part to severe weather and a temporary 35,000-worker Kaiser Permanente strike. Job growth was highly concentrated in healthcare, construction, and transportation, while federal government employment continued to decline.9
  • Four FOMC dissents, the most since 1992: The April 28 to 29 FOMC meeting held the federal funds rate at 3.50% to 3.75% in an 8-to-4 vote, the most dissents at a single Fed meeting since October 1992. Three regional presidents dissented against forward-guidance language in the statement that suggested the next rate move would be lower. Governor Stephen Miran, who has dissented at every meeting since joining the Board in September 2025, again favored an immediate 25 basis point cut. The hawkish dissents were grounded in the data: with March CPI at 3.3% year over year, accelerated from 2.4% in February, and headline CPI rising 0.9% month over month driven by a 21.2% gasoline price surge, there is no clear basis to signal future easing. April was Chair Powell’s last FOMC meeting; his term as Chair ends May 15, however Powell has indicated he intends to remain on the Fed Board through his governor term ending in January 2028, with Kevin Warsh expected to take the seat currently held by Stephen Miran on a temporary basis.10 11 12

Implications for Investors: The market’s April rally embedded a meaningful assumption that the Iran conflict would resolve relatively quickly and that energy prices would normalize. The conditions on the ground do not yet support that assumption. Investors should expect continued gyrations in the equity markets in the days to come as oil prices will remain volatile until we see a lasting resolution. We expect energy to remain an inflationary pressure for the remainder of 2026, at least. The Fed dissents signal that the FOMC is not in a hurry to cut rates.

Stagflation Then and Now: How 2026 Compares to the 1970s

Comparisons to the stagflation of the 1970s have re-emerged in market commentary, and the parallels are real enough to take seriously. The triggering events rhyme: a Middle East-driven oil shock has arrived alongside an inflation impulse at a moment when growth is already slowing, leaving the Federal Reserve to navigate a dual-mandate conflict it has not faced in four decades. The differences, however, are equally important, and they explain why the equity market response in 2026 has been so different from the experience of the 1970s. Understanding both sides of that comparison matters for how the rest of this cycle is likely to unfold.

  • Energy intensity of the economy has fallen by more than half: The single most important structural difference between 2026 and the 1970s is how much oil it takes to produce a unit of economic output. Yale’s Budget Lab estimates that the oil intensity of U.S. GDP has declined by more than 50% since 1973. Hence an identical oil price shock today produces a meaningfully smaller drag on GDP and a smaller pass-through to core inflation than it would have produced fifty years ago.13
  • Inflation expectations are anchored, not unanchored: In the 1970s, the inflation problem became self-reinforcing because expectations of higher future inflation were embedded into wage and price setting behavior. Between 1968 and 1970, before the first oil shock, expected inflation in the University of Michigan survey rose from 3.8% to 4.9%. Today, by contrast, longer-term inflation expectations remain near the Federal Reserve’s 2% target. The April FOMC minutes documented committee concern about whether the energy shock could break that anchor; that concern is the central reason the Fed has resisted cuts despite a softening labor market.10 14
  • Debt levels and fiscal flexibility constrain the policy response: The U.S. economy of 2026 is not the U.S. economy of 1981. Federal debt held by the public stands at approximately 100% of GDP, compared to roughly 25% when Volcker began his tightening cycle, when the Federal Reserve raised the federal funds rate to roughly 20% to break the inflation spiral. Corporate debt levels and household debt service costs are similarly elevated. The implication is not that stagflation is impossible, but that the policy tools available to combat it are narrower than they were forty-five years ago, and the cost of using them aggressively would be higher. Thus, we’re unlikely to see the Fed return to a strategy of double-digit federal funds rates as they did in the Volcker years.15
  • Productivity and the structure of growth differ sharply: The 1970s economy was characterized by slowing productivity growth, declining global competitiveness in U.S. manufacturing, and limited investment in productivity-enhancing technology. The 2026 economy is the opposite: productivity growth has accelerated, with technology-related investment being one of the primary catalysts of global growth. Stagflation in the 1970s persisted in part because there was no offset to the cost shock; today, the productivity story provides at least a partial offset.16 1

Implications for Investors: The structural advantages that distinguish 2026 from the 1970s are meaningful. Each one: anchored inflation expectations, lower energy intensity, and a productivity-supported earnings backdrop, is a condition that can be tested, not a permanent feature of the economic landscape. Portfolios should not be positioned for a re-run of the 1970s, but investors should recognize that the conditions which have prevented stagflation from taking hold are worth monitoring carefully. Diversification across asset classes, geographies, and inflation-sensitive exposures remains the prudent posture.

The Takeaway

The April rally was not built on optimism alone. It was built on earnings that delivered, productivity gains that have shown up in margins, and structural conditions that distinguish this episode from the 1970s. Anchored inflation expectations and an earnings cycle that justifies premium valuations depend on the energy shock proving temporary, the labor market avoiding sharp deterioration, and the Q1 earnings momentum extending into the back half of the year. Each of those is plausible; none is certain. We remain cautiously optimistic on the balance of the year while expecting periods of volatility along the way.


Returns of Market Indices

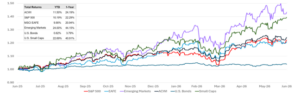
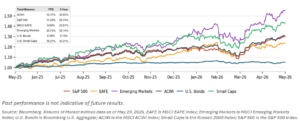
U.S. equities posted their strongest monthly gain since 2020, with the S&P 500 closing April at 7,209, an all-time record high; the Nasdaq Composite also reached new closing records during the month, ending at approximately 24,892.3 Global equity markets rose dramatically (MSCI ACWI +10.2%), led by emerging markets (MSCI Emerging Markets Index +14.7%); U.S. large caps (S&P 500) rose 10.5%, while U.S. small caps rose even further (Russell 2000 +12.3%). International developed equities (MSCI EAFE) rose at a slower pace, but still strong at +7.6%. Fixed income returns were mixed: rising oil prices and the FOMC’s hawkish hold pressured longer-duration Treasuries, with the 10-year yield finishing the month near recent highs. Bond markets (Bloomberg U.S. Aggregate) were nearly flat (+0.1%).YTD Returns are shown in the chart below. 17


Sources
1. FactSet, Earnings Insight (insight.factset.com), April 24, 2026 update. Blended Q1 2026 earnings growth rate 15.1% (vs. 13.1% expected at March 31); 28% of S&P 500 reported as of April 24; 84% beat EPS estimates with magnitude of beats at 12.3% (vs. 5-year average 7.3%). Net profit margin 13.4%, the highest level since FactSet began tracking the metric in 2009. Forward 12-month P/E ratio 20.9. Information Technology sector net profit margin 29.1% in Q1 2026 vs. 25.4% in Q1 2025.
2. TheStreet, “Stock Market Today: S&P 500 caps off best month since 2020 as Alphabet rallies, Apple beats,” April 30, 2026; CNBC, April 30, 2026 stock market live updates. Alphabet up approximately 34% in April, strongest monthly gain since 2004; Meta Platforms down approximately 9% after raising 2026 capex guidance to $125 billion to $145 billion; Microsoft down approximately 4% on Q1 results.
3. CNBC, “Dow surges nearly 800 points, S&P 500 posts first close above 7,200 and best month since 2020,” April 30, 2026; CNBC, “Stock market today: live updates,” April 27 and April 30, 2026. S&P 500 closing level 7,209.01 on April 30, 2026; Nasdaq Composite 24,892.31; Dow Jones Industrial Average 49,652.14. Brent crude near $120/bbl, WTI near $107 at month-end. California gasoline at $6.01/gallon per AAA data.
4. Fortune, “Iran offers to reopen Strait of Hormuz amid oil price surge, but Trump seems unlikely to accept,” April 27, 2026; CNBC, April 30, 2026 market updates citing Wall Street Journal and Axios reports; Reuters and AP coverage of U.S.-Iran ceasefire (April 7 to 8) and Iran’s April 17 declaration that the Strait of Hormuz was open during the truce (oil prices fell 11% on the announcement). The administration extended the ceasefire indefinitely on April 22 and declined the Iran proposal to reopen the Strait permanently. CENTCOM reportedly prepared plans for additional strikes per Axios.
5. AAA national average gasoline prices, accessed April 30, 2026; CNBC reporting on California gasoline prices ($6.01/gallon, highest since October 2023).
6. CNBC, “Stock market today: live updates,” April 30, 2026 and May 1, 2026. ISM Manufacturing Prices Index reached 84.6 in April, highest level since April 2022.
7. International Energy Agency, Oil Market Report, April 2026 (per 24/7 Wall St. citation, April 30, 2026). 2026 global oil demand forecast revised lower by 730,000 barrels per day; Q2 2026 demand contraction projected at approximately 1.5 mb/d, the sharpest decline since the COVID-19 pandemic. Demand destruction concentrated in Middle East and Asia Pacific.
8. Bureau of Economic Analysis, “GDP (Advance Estimate), 1st Quarter 2026,” released April 30, 2026 (bea.gov). Real GDP increased at an annual rate of 2.0% in Q1 2026, following 0.5% growth in Q4 2025. Q1 contributors included investment, exports, consumer spending, and government spending. Congressional Research Service, “The 2025 (FY2026) Government Shutdown: Economic Effects,” R48832: shutdown ran October 1 through November 12, 2025, lasting 43 days, the longest in U.S. history. CBO estimated the shutdown reduced Q4 2025 GDP growth by approximately 1.5 percentage points at an annual rate.
9. Bureau of Labor Statistics, “The Employment Situation – March 2026,” released April 3, 2026 (bls.gov). Total nonfarm payroll employment increased by 178,000 in March; unemployment rate at 4.3%. Job gains in healthcare (+76,000), construction, and transportation and warehousing; federal government employment continued to decline. February revised down by 41,000 to -133,000. CNBC, “Jobs report March 2026,” April 3, 2026: ambulatory health care services rose 54,000, with 35,000 reflecting return of striking Kaiser Permanente workers.
10. Federal Reserve, FOMC Statement, April 29, 2026; Federal funds target range held at 3.50% to 3.75% in an 8-to-4 vote, the most dissents at a single FOMC meeting since October 1992. Hawkish dissents from Beth Hammack (Cleveland), Neel Kashkari (Minneapolis), and Lorie Logan (Dallas), each opposing the forward-guidance language. Governor Stephen Miran dissented in favor of an immediate 25 basis point cut, his sixth consecutive dissent since joining the Board in September 2025. Powell intends to remain on the Board through his governor term ending January 2028.
11. Bureau of Labor Statistics, Consumer Price Index Summary, March 2026 release (April 10, 2026). March CPI +3.3% year over year (accelerated from 2.4% in February); core CPI +2.6%; gasoline prices +21.2% month over month, the largest monthly increase since the gasoline series was first published in 1967; energy prices +10.9% in March, largest monthly increase since September 2005. Headline CPI +0.9% month over month.
12. Federal Reserve, H.15 Selected Interest Rates (federalreserve.gov), data as of late April 2026. 10-year Treasury constant maturity finishing April near recent highs.
13. Yale Budget Lab, “What Are the Macroeconomic Implications of Recent Turmoil in Oil Markets?,” March 27, 2026: oil intensity of U.S. GDP has declined by more than 50% since 1973; the U.S. is now a net petroleum exporter, with a $58 billion petroleum trade surplus in 2025 (Loomis Sayles, March 2026 analysis citing Haver Analytics and S&P Global). Center on Global Energy Policy at Columbia University, “Oil Intensity: The Curiously Steady Decline of Oil in GDP”: global oil intensity peaked in 1973 at approximately 1 barrel per $1,000 of global GDP, declining to 0.43 barrels per $1,000 by 2019.
14. Reserve Bank of Australia, “Oil Price Shocks, Monetary Policy and Stagflation,” Conference Volume 2009 (Lutz Kilian): inflation expectations anchoring is the principal explanation for the absence of 1970s-style stagflation in subsequent oil shocks. University of Michigan Survey of Consumers, historical data: expected inflation rose from 3.8% to 4.9% between 1967 and 1970, before the first oil shock.
15. Federal Reserve Bank of St. Louis (FRED) historical data: federal debt held by the public approximately 100% of GDP as of recent quarter, compared to approximately 25% in 1980 to 1981. Federal Reserve historical effective federal funds rate: peaked at approximately 20% in 1981 under Chair Paul Volcker.
16. OECD, Economic Outlook Interim Report, March 2026 (oecd.org). Global GDP growth projected at 2.9% in 2026; technology-related investment cited as a key pillar of projected global growth.
17. Bloomberg index returns as of April 30, 2026. April 2026 monthly total returns: MSCI ACWI Index +10.2%; MSCI Emerging Markets Index +14.7%; S&P 500 Index +10.5%; Russell 2000 Index +12.3%; MSCI EAFE Index +7.6%; Bloomberg U.S. Aggregate Bond Index +0.1%. All figures sourced from Bloomberg terminal data; final returns should be verified directly via Bloomberg Index Services or relevant index provider factsheets prior to publication.

Planning for Long-Term Care

Long-term care is one of the most significant financial risks facing families, yet it is often overlooked. As life expectancies increase, and medical advances allow people to live longer with chronic conditions, the likelihood increases that an individual eventually will require some form of long-term care. A study by the US Dept. of Health and Human Services found that 70% of adults who survive to age 65 develop severe LTSS needs before they die and 48% receive some paid care over their lifetime.1

Now, more than ever, it is prudent to have a long-term care strategy that evaluates potential care needs, estimates costs, and weighs potential funding options.

What is Long-Term Care and How Much will it Cost?

Long-term care typically includes assistance with “activities of daily living” such as bathing, dressing, eating, and mobility, as well as supervision for cognitive conditions such as dementia. Care may be provided at home, in assisted living communities, or in skilled nursing facilities.

Cost is key because care services can be expensive and are generally not covered by traditional health insurance or Medicare. The cost of long-term care varies widely depending on the type of care and geographic location. In many parts of the United States, home health aides may cost $25 to $35 per hour, assisted living communities may cost $5,000 to $7,000 per month, and nursing home care can exceed $100,000 per year.2 As you plan ahead, it’s important to note that these costs tend to increase faster than general inflation due to rapidly rising labor and healthcare expenses.

Because care needs may last several years, the total financial exposure can be significant. Some individuals require only short-term care following a medical event, while others, particularly those with cognitive decline, may need care for many years. For those who enter assisted living, the average stay in a nursing home is about 485 days, or a little over a year, according to a report by the Department of Human Services and the National Center for Health Statistics.3

Timing is Everything

An important step in long-term care planning is addressing the issue well before care is needed. Waiting until retirement or until health conditions emerge can significantly limit available options. Insurance premiums rise with age, and pre-existing health issues may make individuals ineligible for coverage.

It’s recommended that family members begin evaluating long-term care planning options in their mid-50s to early 60s. At this stage of life, most people are still healthy enough to qualify for insurance, yet close enough to retirement to realistically evaluate their financial resources and goals.

Starting early also allows families to incorporate long-term care considerations into a broader financial plan that includes retirement income, investment strategy, estate planning, and tax planning. Think about how you want to age; do you want to stay at home, go into assisted living, or live in a community?

Is Long-Term Care Insurance the Right Choice?

Long-term care insurance was originally developed to help individuals protect their savings from the potentially high costs of extended care. Traditional policies typically pay a daily or monthly benefit toward qualifying care expenses once the policyholder meets certain conditions, such as needing assistance with multiple activities of daily living.

However, the long-term care insurance market has evolved over the past two decades. Premiums have increased for many policies due to higher-than-expected claims and lower investment returns for insurers. As a result, fewer companies offer traditional policies today, and consumers must evaluate coverage carefully.

Despite these changes, long-term care insurance remains an effective solution for many households, particularly those with moderate to substantial assets who wish to protect their retirement savings from a potentially large medical expense.

The Hybrid Option

In response to concerns about traditional long-term care insurance, many insurers now offer hybrid policies that combine long-term care coverage with life insurance or annuity products. These policies typically allow policyholders to access a portion of the death benefit to pay for long-term care expenses if needed. If care is never required, beneficiaries receive the remaining death benefit.

Hybrid policies address one of the most common objections to traditional long-term care insurance – the fear of paying premiums for something you may never use. While hybrid policies often require larger upfront premiums, they provide more certainty about the value of the benefits.

For individuals who have accumulated significant savings and want both asset protection and estate planning flexibility, hybrid policies can be an attractive option.

When Does Self-Funding Make Sense?

Long-term care insurance is not necessarily appropriate for every family. Some households may be better served by self-funding potential care expenses. This approach involves intentionally setting aside a portion of retirement assets to cover possible care costs.

Self-funding may be appropriate for individuals with substantial wealth who can comfortably absorb several years of care expenses without jeopardizing their lifestyle or legacy goals. In these situations, insurance premiums may represent an unnecessary cost.

However, self-funding requires discipline and realistic planning. Families should estimate potential care costs, consider inflation, and ensure that sufficient resources remain available even if care expenses occur late in retirement.

Staying Flexible

One of the challenges of long-term care planning is the uncertainty surrounding future needs. It is impossible to predict whether care will be required, what type of care will be necessary, or how long it may last. For this reason, flexibility is key.

Some families combine strategies. For example, purchasing a modest insurance policy to cover potential expenses while reserving personal assets for additional costs. Others may rely on investment income and home equity as part of their care funding strategy.

Whatever the care strategy, regularly reviewing long-term care plans is important. As financial circumstances change, families may adjust their coverage levels, asset allocation, or care preferences.

Legislative Changes

Some states have begun considering statewide payroll taxes to help fund long‑term care and other state‑run programs. Washington was the first to implement such a measure, introducing a mandatory 0.58% payroll tax on all W‑2 employees with no income cap to support its program. The only way to be exempt from this tax was to purchase private long‑term care insurance before November 1, 2021. California, New York, Minnesota, and Illinois are actively developing or evaluating similar legislation, with several other states exploring related initiatives.

Integrating Long-Term Care into a Comprehensive Financial Plan

Whether individuals choose insurance, self-funding, or a combination of both, long-term care planning should be integrated into a broader financial strategy. Retirement income projections should incorporate potential healthcare costs, and investment portfolios may need to include liquid assets that can be accessed if care becomes necessary.

Estate planning also plays an important role. Legal documents such as durable powers of attorney, healthcare proxies, and advance directives help ensure that trusted individuals can make decisions if a person becomes unable to manage their affairs. These documents can also clarify preferences regarding the type of care and living arrangements desired.

Keeping the Goal in Mind

Long-term care planning is ultimately about maintaining independence, dignity, and financial stability in later life. By considering potential care needs early and evaluating the available funding strategies, families can avoid making difficult decisions during a time of crisis.

A proactive plan, whether through insurance, self-funding, or a combination of both, provides peace of mind that resources will be available if care becomes necessary. It also allows families to focus on enjoying retirement, knowing that an important financial risk has been addressed.

If you are not yet a Crestwood client, we welcome the opportunity to connect and support you, contact us.

Sources:
  1. US. Department of Health and Human Services, ASPE, What Is the Lifetime Risk of Needing and Receiving Long-Term Services and Supports? April 2019.
  2. Carescout.com,“Calculate the cost of long-term care near you,” updated March 3, 2026 (carescout.com). Actual costs may vary by location, provider, and level of care required.
  3. Care.com, Wendy Wisner, “How Long Is the Average Nursing Home Stay?” updated August 19, 2025 (care.com).

Crestwood Advisors Named Once Again to USA TODAY’s 2026 Best Financial Advisory Firms List

BOSTON (April 17, 2025) – Crestwood Advisors (“Crestwood”), a boutique investment advisory and wealth management firm based in Boston with offices in Connecticut and Rhode Island, is proud to announce it has once again been named to the USA TODAY list of the Best Financial Advisory Firms in the U.S. for 2026.

This national list highlights firms demonstrating sustained growth, industry credibility and a strong commitment to client service in an increasingly competitive advisory landscape.

“To be recognized by USA TODAY once again is especially meaningful,” said Crestwood President and Managing Partner Leah R. Sciabarrasi, CFP®. “Consistency matters in our business – not just in performance, but in how we show up for clients. This recognition reflects our team’s commitment to building long-term relationships, navigating complexity alongside our clients, and delivering advice that adapts as their lives and priorities evolve.”

The USA TODAY Best Financial Advisory Firms list, developed in partnership with market research firm Statista, ranks the top 1,000 Registered Investment Advisors (RIAs) across the U.S. Firms are evaluated based on both short- and long-term growth in assets under management (AUM), as well as the number of recommendations received from clients and peers. Advisors are also grouped into four categories based on firm size, ranging from under $500 million to over $5 billion in assets.

Crestwood’s continued inclusion reflects its ability to maintain momentum while staying grounded in a client-first philosophy – helping individuals and families navigate complexity with clarity, discipline and a long-term perspective.

Crestwood did not pay a fee to be considered for or included on the list.


###


About Crestwood Advisors
Crestwood Advisors is an independent, fee-only, wealth management firm with approximately $8.02 billion in assets under management as of December 31, 2025. Founded in 2003, Crestwood Advisors provides investment management with financial planning strategies to help high-net-worth individuals and families identify and prioritize their goals and build sustainable wealth so that they may enjoy more financially secure and purposeful lives. For more information, please visit https://www.crestwoodadvisors.com.

April 2026 Economic and Market Update: Geopolitics at the Forefront

The U.S.-Iran conflict escalated in late February, shifting from a geopolitical risk to a real supply disruption. Markets responded with a broad risk-off move across equities and bonds.

The Strait of Hormuz and the Energy Shock

On March 4, Iranian forces declared the Strait of Hormuz closed, restricting tanker traffic through a waterway that carried roughly 20 million barrels of oil per day as of 2024, representing approximately 27% of global maritime petroleum trade.1 The commercial shipping community responded immediately: insurers withdrew coverage and major oil companies halted transits. Brent closed above $100 per barrel on March 12, the first time since August 2022.2 The International Energy Agency characterized the disruption as the largest in the history of the global oil market.3

  • The scope of the selloff: March’s selloff was broad-based, with most sectors declining and only Energy posting a meaningful gain. The S&P 500 returned -4.3% in the first quarter, but index-level results still diverged sharply: the Russell 1000 Growth Index fell 9.8%, while the Russell 1000 Value Index rose 2.1%. That gap was driven largely by index composition, as value benchmarks benefited from their heavier exposure to Energy. However, the dominant impulse across the market overall was macro de-risking, not rotation.4
  • Treasury yields increased: Treasury yields rose sharply throughout the month. The 10-year U.S. Treasury yield closed near 4.43% as of March 27, up materially from its February month-end level of 4.15%, while the 2-year yield rose in parallel as investors pared back expectations for near-term Fed cuts.5
  • The supply architecture: OPEC+ holds approximately 3.5 million barrels per day of spare capacity, concentrated in Saudi Arabia and the UAE, but a significant portion of that capacity cannot reach global markets if the Strait remains inaccessible. Saudi Arabia and the UAE moved quickly to reroute oil via overland pipelines, and the International Energy Agency coordinated an emergency stock release that could approach 3 million barrels per day. These measures provide a partial buffer, characterized as stop-gap solutions rather than structural offsets. Importantly, the strait remains the bottleneck and overland pipeline capacity covers only a fraction of normal volumes.3, 6

Implications for Investors: The near-term inflation impact is real: U.S. gas prices rose approximately $0.60 per gallon in the two weeks following the start of the conflict, and Bloomberg Economics estimated March CPI at 3.4% year-over-year, up from 2.4% in February. The medium-term economic impact depends almost entirely on how long the Strait remains disrupted. Combined with slower job growth and sluggish wage increases, higher energy costs are likely to hurt lower-income consumers. This volatility is a reminder that while geopolitical risk can never be avoided entirely, there are tangible benefits to being diversified across sectors, geographies, and asset classes.

The Fed: Holding Course While the Map Changes

The Federal Open Market Committee met on March 17 and 18 and voted 11 to 1 to hold the federal funds rate unchanged at 3.50% to 3.75%.7 The decision was widely anticipated. What made the meeting notable was what the committee said, not what it did. The FOMC statement explicitly acknowledged that developments in the Middle East create uncertainty for the U.S. economy, a direct insertion of the conflict into the official policy framework. Chair Powell summarized the committee’s posture with characteristic plainness: the Fed simply does not yet know what the economic consequences of the conflict will be.

  • The inflation data (before the shock): February CPI came in at 2.4% year-over-year, matching January’s 2.4% and down from 2.7% in December 2025, and core CPI rose 2.5%. Those readings were constructive. The energy-driven inflation shock that began in early March will not fully appear in official data until April and May releases.10
  • Updated projections: The March Summary of Economic Projections (aka the “Fed’s Dot Plot”) revised inflation projections upward, with the median Personal Consumption Expenditure (PCE) inflation forecast for 2026 increasing 0.3% to 2.7%, the largest single-year upward revision in recent memory. The median projected federal funds rate for year-end 2026 remains at 3.4%, implying one additional 25-basis-point cut over the remainder of the year.7, 8
  • Shifting Expectations: Before the conflict, futures markets were pricing two rate cuts in 2026 with a small probability of a third. By month-end, the consensus had collapsed to at most one cut, with CME FedWatch showing a meaningful probability of no cut at all this year. Seven of 19 FOMC participants indicated in the dot plot that they expect rates to stay unchanged through year-end, one more than in December.7, 9

Implications for Investors: The Fed’s current position is genuinely uncomfortable: headline inflation is heading higher in the near term due to energy prices, growth data is softening, and the committee has limited room to act in either direction without signaling something it does not intend. The Fed tends to watch Core inflation, which excludes often-volatile energy and food prices, because it is a better gauge of persistent price trends. During periods of sharply rising energy prices, like today, the Fed will be watching Core inflation to see if this results in higher costs in other goods and services.

A disruption that resolves quickly would allow the committee to resume its easing path and reassure bond markets. Prolonged disruption risks entrenching elevated inflation expectations. How events unfold from here will depend almost entirely on the timeline of the disruption. In either scenario, portfolio duration and credit quality are the levers most worth watching.

Trends Worth Noting

  • The AI investment cycle has not been disrupted by the selloff: The March drawdown was a macro event, not an AI story, and the distinction matters. AI capex commitments from major technology companies have not reversed and earnings from the tech sector are expected to significantly outpace the rest of the market. The risk is not that AI investment collapses; the risk is that a prolonged energy shock delays the translation of that investment into bottom-line results.11
  • Earnings resilience is holding: Despite the market selloff, the fundamental earnings backdrop has not broken down. S&P 500 companies are expected to report double-digit earnings growth for a sixth consecutive quarter in Q1 2026, with FactSet’s blended estimate at 13.2% year-over-year as of early April. Energy sector earnings revisions have turned sharply positive. The broader question entering the second quarter is whether oil-driven cost pressures and weakening consumer confidence begin to show up in guidance. 11, 13
  • Stagflation concerns are rising: The combination of energy-driven inflation and softening growth data has put the S-word back on investors’ radar. February job openings fell to 6.88 million, with the hires rate dropping to 3.1%. This was the lowest since the early months of the pandemic and may be an indication that the labor market is losing momentum. What distinguishes the current episode from the 1970s analogy, at least for now, is that longer-term inflation expectations remain well anchored, and corporate earnings have not yet deteriorated. If either deteriorates, stagflation could be on the horizon.12


The Takeaway

The Strait of Hormuz crisis triggered a selloff that cut across styles, market capitalizations, and sectors as a sudden repricing of inflation and growth simultaneously overwhelmed the reallocation logic that normally drives market rotation. The Fed is navigating a dual-mandate conflict with limited room to maneuver, earnings have held up but the economic landscape is changing, and the resolution of the energy shock depends on a variable no economic model can forecast. What the Trends and Implications described above share is that they were in motion before March and will outlast it: the stagflation debate, the AI capex cycle, and the argument for geographic diversification are not products of one difficult month. Patience, breadth, and a bias toward quality remain the prudent investment philosophy.


RETURNS OF MARKET INDICES

Global equity markets saw large declines in March as a whole (MSCI ACWI -7.1%) led by Emerging Markets (MSCI Emerging Market Equity Index -13%). U.S. large caps (S&P 500) fared better during this period but were still down 5%, in line with U.S. small caps (Russell 2000 -5%). International developed (MSCI EAFE) equities fell 10%. Bonds declined by 1.8% for the month.  YTD returns are shown in the chart below.14

Sources
  1. U.S. Congressional Research Service, “Iran Conflict and the Strait of Hormuz: Impacts on Oil, Gas, and Other Commodities,” R45281, updated March 2026. Approximately 27% of world maritime oil trade transits the Strait; 2024 volumes approximately 20 million barrels per day.
  2. CNBC, “Brent oil closes at $100 after Iran’s new supreme leader says Strait of Hormuz must remain closed,” March 12, 2026; CNBC, “Front-month Brent oil futures extend gains after record monthly rise in March,” April 1, 2026 (citing LSEG data). Brent closed above $100 on March 12; reached an intramonth high before easing; Brent monthly gain approximately 64%, a record per LSEG data dating to 1988. WTI gained approximately 51% in March, best month since May 2020.
  3. International Energy Agency, Oil Market Report, March 2026. Characterized as the largest supply disruption in the history of the global oil market. Global oil supply projected to fall approximately 8 mb/d in March. Brent futures traded within a whisker of $120/bbl at intramonth high.
  4. S&P Global Market Intelligence, “US REIT stocks outperform broader stock market in Q1 2026,” April 2026 (citing S&P Dow Jones Indices data as of March 31, 2026): S&P 500 Q1 2026 total return -4.3%. Russell style and size returns from Confluence Financial Partners, “First Quarter 2026 Market Recap,” April 2026, citing Morningstar and FTSE Russell data as of March 31, 2026: Russell 1000 Growth -9.78%; Russell 1000 Value +2.10%; Russell 2000 +0.89%.
  5. Federal Reserve, H.15 Selected Interest Rates (federalreserve.gov). 10-year Treasury constant maturity: approximately 4.15% at February 28 month-end, 4.43% as of March 27. Bloomberg U.S. Aggregate Bond Index: fell -1.76% in March; Q1 2026 total return -0.05%, per Confluence Financial Partners, “First Quarter 2026 Market Recap,” April 2026, citing Bloomberg data as of March 31, 2026.
  6. IEA, Oil Market Report, March 2026. OPEC+ spare capacity approximately 3.5 mb/d. IEA coordinated emergency stock release; U.S. Energy Secretary Chris Wright indicated a release that could approach 3 mb/d per CNBC, March 12, 2026.
  7. Federal Reserve, “Federal Reserve Issues FOMC Statement,” March 18, 2026; Federal Reserve, Summary of Economic Projections, March 18, 2026. Federal funds rate held at 3.50%-3.75%; 11-to-1 vote.
  8. Federal Reserve, Summary of Economic Projections, March 18, 2026. GDP median revised to 2.4% for 2026; PCE inflation median revised to 2.7% for 2026 (+0.3 percentage points vs. December 2025 projections). Median end-2026 federal funds rate projection 3.4%, implying approximately one additional 25 basis point cut.
  9. CNBC, “Fed Interest Rate Decision March 2026,” March 18, 2026; Kiplinger, “March Fed Meeting: Updates and Commentary,” March 18, 2026. Seven of 19 FOMC participants projected no cut in 2026.
  10. Bureau of Labor Statistics, Consumer Price Index Summary, February 2026 (bls.gov). February CPI +2.4% year-over-year; January CPI +2.4% year-over-year (down from 2.7% in December 2025); core CPI (all items less food and energy) +2.5% year-over-year.
  11. FactSet, Earnings Insight, week of April 2, 2026 (insight.factset.com). Q1 2026 blended EPS growth estimate: 13.2% year-over-year, which would mark the sixth consecutive quarter of double-digit earnings growth. Energy and Information Technology sectors recorded the largest upward EPS revisions since December 31.
  12. Bureau of Labor Statistics, Job Openings and Labor Turnover Survey (JOLTS), March 2026 release (bls.gov), reporting February 2026 data. Job openings fell 358,000 to 6.882 million at end of February 2026. U.S. EIA Short-Term Energy Outlook, March 2026 (eia.gov): gasoline prices forecast approximately 60 cents/gallon higher in March due to higher crude prices; national average exceeded $4/gallon by end of March per TPFG Market Pulse March 2026 (citing Bloomberg).
  13. S&P Global Market Intelligence, “Global Economic Outlook: March 2026,” March 2026. U.S. and Canada characterized as net energy exporters facing relatively mitigated Hormuz economic impact. Index return figures cross-referenced against endnote 4.
  14. Bloomberg. Returns of Market Indices chart data as of March 31, 2026. EAFE is MSCI EAFE Index; Emerging Markets is MSCI Emerging Markets Index; U.S. Bonds is Barclays U.S. Aggregate; ACWI is the MSCI ACWI Index; Small Caps is the Russell 2000 Index; S&P 500 is the S&P 500 Index. March 2026 returns shown.

Beyond the Numbers: How Women Are Redefining the Experience of Wealth

For many women, wealth is not just about accumulation, it’s about flexibility, independence, and the ability to navigate life’s complexities with confidence. That perspective is increasingly shaping how financial decisions are made and what long-term success looks like.

March offers a natural moment to pause and reflect on the achievements, influence, and evolving roles of women. In the U.S., it’s recognized as Women’s History Month, and globally, March 8th marks International Women’s Day. In that spirit, it is also an opportunity to consider how women often experience life, and wealth, a bit differently. Not in ways that need to be overcomplicated, but in ways that are important to recognize.

For many women, the financial journey is shaped less by a straight line and more by the rhythm of life itself, periods of momentum, pause, responsibility, and reinvention. Careers may evolve alongside family needs, raising children, supporting aging parents, or recalibrating priorities as circumstances change. These decisions are rarely made in isolation; they reflect values, relationships, and a broader definition of what it means to build a life of purpose.

At the same time, women often carry a longer time horizon. Living longer on average can mean more chapters, more time spent building, supporting others, and eventually navigating life independently.  Over time, many women step into greater financial responsibility, sometimes gradually, sometimes all at once. What begins as a shared effort can become more individual, bringing both opportunity and complexity.

These shifts don’t always come with a clear roadmap. Historically, many women were less involved in day-to-day financial decisions, often by design or circumstance. That dynamic is changing.  More women are engaging earlier, asking thoughtful questions, seeking context, and wanting to understand not just what decisions are being made, but why. Confidence tends to build not from having every answer, but from developing a clear sense of direction over time.

There are also broader realities that shape this experience. Differences in earnings and career paths still exist, and while they may feel incremental in the moment, they can compound over time. What stands out, however, is how many women approach these dynamics, with a steady, long-term mindset and a focus on making thoughtful, intentional decisions. That discipline, grounded in consistency rather than reaction, can be a meaningful advantage over time.

We are also in the midst of a broader shift. As wealth transitions across generations, women are increasingly stepping into the role of primary decision-maker. Often, this occurs during already significant life moments, times that require both reflection and action. With that comes an opportunity to shape not just financial outcomes, but the role wealth plays more broadly: supporting family, enabling flexibility, and creating a sense of stability and independence.

This Women’s History Month, it is worth recognizing not just how much has changed, but how women continue to shape what comes next, within families, communities, and across generations. While every path is different, the desire for clarity and confidence remains consistent.

At Crestwood, we work closely with women navigating these moments, whether that means stepping into greater financial responsibility, balancing competing priorities, or simply wanting a clearer understanding of where things stand. If this resonates, we would welcome the opportunity to continue the conversation.


Refocus, Refresh, and Reset Your Financial Life This Spring

Spring cleaning is a familiar ritual. We open the windows, clean out closets, and refresh the spaces we inhabit every day. But just as dust accumulates in the corners and under the beds of our homes, financial clutter can quietly accumulate in our accounts, documents, and financial plans.

Financial “spring cleaning” is not necessarily about making dramatic changes. Rather, it’s about restoring clarity and intention. By organizing accounts, updating beneficiaries, reviewing account titles, reevaluating cash flow, savings, and retirement assets, and refreshing your financial plan, you can keep your financial life aligned with your goals.

Update Beneficiaries
One often-overlooked aspect of financial housekeeping is designating beneficiaries. Retirement accounts, life insurance policies, and certain brokerage accounts pass directly to named beneficiaries, outside of your will. Outdated designations, especially following major life events like marriage, divorce, birth of a child, or death of a loved one, can result in unintended consequences.

Review each account and confirm that both primary and contingent beneficiaries reflect your current wishes. Don’t ignore the “per stirpes” option to ensure your intended split. If your estate plan includes a revocable trust, ensure that beneficiary designations align with that structure.

Update Estate Planning Documents
In addition to beneficiary updates, review core estate planning documents such as wills, trusts, powers of attorney, and healthcare directives. Laws change, family circumstances evolve, and financial complexity increases over time. An estate plan drafted years ago, or in another state, may no longer reflect your current circumstances.

Confirm that executors, trustees, or guardians remain appropriate choices. Ensure that your powers of attorney are current and recognized by financial institutions. Don’t forget to address digital assets, including instructions for accessing online accounts.

Simplify Your Financial Life
Financial clutter often results from career transitions. Many individuals accumulate multiple employer-sponsored retirement plans over time. Leaving assets scattered across several 401(k) accounts can make investment management more complicated and may increase fees.

Rolling these into one or two IRAs (Rollover and/or Roth, depending on the tax treatment) can centralize investments, broaden available investment options, and reduce administrative complexity.

Streamlining can also apply to non-retirement accounts. Consolidating accounts may improve reporting efficiency, reduce paperwork, and enhance coordination with your advisor. Fewer accounts often mean fewer blind spots and fewer online passwords to remember. Always use strong, unique passwords to safeguard your online presence and update them periodically.

Refresh Your Investment Strategy
Over time, market movements can cause portfolios to drift away from their intended allocation. In addition, there may have been changes to your situation that can affect your investment strategy. Spring cleaning provides an opportunity to review asset allocation, risk exposure, and performance of your investments with your team to determine if your asset allocation should be adjusted to restore alignment with your goals and risk tolerance.

Evaluate whether your portfolio still reflects your time horizon, liquidity needs, and current economic circumstances. For retirees or those nearing retirement, confirm that sufficient liquid assets are still available to fund short-term needs without forced selling during periods of volatility. For younger investors, ensure that growth-oriented allocations remain consistent with long-term objectives.

Check Your Coverage
It can also be a good time to reassess insurance coverages. Review life insurance amounts relative to income replacement needs, debt obligations, and education funding goals. Confirm that disability insurance remains adequate, especially if income has increased. Evaluate property and umbrella liability coverage to ensure sufficient asset protection.

As your net worth grows, so does your risk exposure. Proper coverage provides peace of mind and preserves financial stability in the face of unexpected events.

Plan For the Future
Finally, spring offers a natural opportunity to refresh your perspective and plan for the future. It can be a time to speak with your advisor to revisit and clarify short- and long-term goals including cash flow, retirement savings and timing, education funding, home purchases, charitable giving, business succession, or travel plans.

Cash flow planning is key. Reexamining your cash inflows and outflows allows you to best align resources with priorities. If extra cash exists, deploy it strategically toward investment or debt reduction. If constraints exist, adjust spending or savings accordingly.

Restoring Order
Spring cleaning is not always fun, but the sense of order it brings is rewarding. The same is true when you take time to bring clarity and organization to your financial life. By stepping back to organize, streamline, and revisit your plan, you can help ensure your finances remain aligned with your goals and priorities.

Just like spring cleaning your home, organizing your finances is easier with a plan. Start by building a checklist of priorities and let your Crestwood team guide you through each step with clarity and confidence.

If you are not yet a Crestwood client, we welcome the opportunity to connect and support you, contact us.

March 2026 Economic Update: The Markets Shifts on AI Expectations

February delivered rotation, drama, and a useful reminder that not all markets move in the same direction at once.

The AI Trade Gets More Complicated
Nvidia posted a genuine blowout fourth quarter, with revenue up 73% year over year and data center demand still accelerating, yet shares fell more than 5% the day earnings were released.1 The Magnificent 7 is now down roughly 7% year to date.2 It was a clean illustration of where the AI trade stands heading into 2026: fundamentals remain strong, but the market has moved from pricing in potential to demanding proof.

  • Disruption anxiety: Mentions of AI disruption on S&P 500 earnings calls nearly doubled from the prior quarter.3 That is encouraging if your company is building the infrastructure. It is considerably less so if your business model might be disrupted by AI. In the market’s crosshairs are software stocks, which have been hit hard over concerns that AI will be easily able to create competing solutions. The stock prices of private credit firms that lend to these software companies likewise pulled back on similar worries.
  • The Counterpoint: Fundamental earnings for most software stocks have remained stable. Many firms have reiterated guidance and some companies like Salesforce announced a massive share buyback, indicating that investors may be overestimating the depth and breadth of AI disruption. So too with private credit funds, where the loan books of higher quality lenders appear healthy.
  • Belief in future success of AI remains high: Open AI raised $110 billion in their most recent round of funding, bringing the estimated valuation to $840 billion.4 This reflects private capital’s seemingly insatiable appetite for AI models. For perspective, at an $840 billion market capitalization, OpenAI would be the 12th largest company in the S&P 500. OpenAI’s revenue is growing quickly, but the path from revenue to durable, defensible profit remains years away.

Implications for Investors: The AI trade is just starting to evolve. The era of rewarding any company with “AI” in its investor deck is giving way to one that demands evidence of monetization, defensible competitive position, and a credible path to returns on capital. Infrastructure providers with genuine pricing power remain attractive. Owning broad, diversified exposure rather than concentrated bets on any single theme, whether hardware, model providers, or AI-adjacent software, remains the prudent strategy. The winners of the next phase may look quite different from the leaders of the last one.

Tariffs, the Supreme Court, and a Messy Macro Backdrop

February produced the most dramatic tariff development since early 2025 when the Supreme Court ruled 6-3 that the president exceeded the International Emergency Economic Powers Act (IEEPA) authority used to impose broad reciprocal tariffs. Those tariffs had pushed the average effective U.S. tariff rate to roughly 16% at their peak, the highest level since the 1930s. The court struck down President Trump’s use of tariffs under IEEPA.

  • The legal response and new tariff authority: President Trump responded by invoking Section 122 of the Trade Act of 1974, a narrower authority that permits tariffs of up to 15% for up to 150 days to address balance-of-payments deficits. A 10% global tariff took effect February 24; the following day the president announced his intention to raise the rate to 15%. Previously negotiated bilateral framework agreements with major trading partners remain in place, for now.
  • Tariff Layer Cake: The IEEPA tariffs were the largest single layer, but not the only one. Other tariffs remain intact: 50% on steel and aluminum, 25% on imported automobiles, and 10% on lumber. The U.S.-China truce also remains in effect. The average effective tariff rate fell from roughly 16% at its peak to an estimated 13.7% following the ruling and the Section 122 replacement.7, 8
  • GDP and the macro backdrop: Fourth quarter growth came in at 1.4%, well below the 2.8% consensus, partly due to the 43-day government shutdown, which likely reduced GDP by 1-2% according to the Congressional Budget Office (CBO). Consumer spending and business investment were both positive underneath the headline, suggesting underlying momentum remains intact.5, 6
  • Inflation and the Fed: January PPI rose 0.5% for the month versus a 0.3% forecast. Core PPI gained 0.8%, more than double expectations. That combination may encourage the Federal Reserve to remain cautious about cutting rates. The next FOMC meeting is March 17 to 18, with updated economic projections to follow. Rate cuts remain possible in 2026, but a re-acceleration in wholesale prices as well as inflationary pressures coming from the new conflict in Iran makes this less certain.7, 8

Implications for Investors: The tariff story has a new chapter but is far from over. The Section 122 tariff expires around mid-July 2026 absent congressional action, creating a near-term policy cliff. New tariff authority is being pursued through additional legal vehicles while companies like Costco who were heavily impacted by the tariffs will seek reimbursement. For investors, diversified geographic exposure remains the sensible hedge. The combination of tariff uncertainty, the evolving situation in Iran and sticky inflation may limit the Fed’s ability to respond if growth weakens.

Trends Worth Noting

  • Buybacks hit a record: Corporate America authorized $233 billion in February repurchases, the largest February on record. Salesforce, Walmart, and Verizon led.9 Companies buying their own stock at this scale represents sustained, informed demand for equities.
  • Small caps outperformed: The Russell 2000 is up roughly 6% year to date while the S&P 500 is essentially flat.10 Smaller companies draw more revenue domestically and stand to benefit most from any eventual Fed rate cuts.
  • International markets led: Developed markets outside the U.S. gained roughly 10% year to date, with the MSCI EAFE logging 14 consecutive weekly gains late in the month.11 Emerging markets added 14%.12 European earnings momentum and a slight dollar decline both helped.

The Takeaway
Earnings season confirmed healthy fundamentals: roughly 14% year-over-year earnings growth, the fifth consecutive quarter of double-digit expansion.13 The underlying economy is slowing from its recent pace but still growing. The rotation toward smaller companies and international stocks validates the case for diversification we have been making for months. Patience and discipline remain the appropriate posture.

RETURN OF MARKET INDICES
Global equity markets (MSCI ACWI) were positive for the month (+1.3%) led by non-U.S. Equities. U.S. large caps were down slightly in February (S&P 500 -0.8%) while U.S. small caps (Russell 2000) were the reverse mirror image, rising by 0.8%. International developed (MSCI EAFE) and emerging market equities (MSCI Emerging Markets Index) were the standouts rising by 4.7% and 5.5%, respectively. Bonds provided quiet ballast as yields drifted lower on slowing growth data, with prices rising 1.6% for the month.


Source: Bloomberg. EAFE is MSCI EAFE Index(1), Emerging Markets is MSCI Emerging Markets(2) and U.S. Bonds is Barclays U.S. Aggregate(3). ACWI is the MSCI ACWI Index(4). Small Caps is the Russell 2000 Index(5). S&P 500 is the S&P 500 Index(6). The above information is as of 2/28/2026.

Sources

1 Bloomberg Equity Markets; Nvidia Q4 FY2026 earnings release, February 26, 2026.

2 Bloomberg Magnificent 7 Index, year-to-date return as of February 27, 2026.

3 Bloomberg transcript analysis of S&P 500 Q4 2025 earnings calls, February 2026.

4 Bloomberg News, OpenAI Series G financing, February 2026.

5 U.S. Bureau of Economic Analysis, Advance Estimate of Q4 2025 GDP, released February 20, 2026.

6 U.S. Congressional Budget Office, estimate of partial government shutdown impact on Q4 2025 GDP growth, February 2026.

7 U.S. Bureau of Labor Statistics, Producer Price Index news release for January 2026, released February 27, 2026.

8 Federal Reserve, FOMC meeting calendar. The March 17 to 18, 2026 meeting will include a Summary of Economic Projections (federalreserve.gov).

9 Birinyi Associates, U.S. corporate buyback authorization data, February 2026, as reported by Bloomberg. $233.3 billion authorized in February, the largest February on record. Individual company figures from company investor relations announcements: Salesforce $50 billion (February 25, 2026); Walmart $30 billion; Verizon $25 billion.

10 Russell 2000 Index and S&P 500 Index, year-to-date total returns as of February 27, 2026. FTSE Russell; S&P Dow Jones Indices.

11 MSCI EAFE Index, year-to-date net total return as of February 27, 2026. MSCI Inc.

12 MSCI Emerging Markets Index, year-to-date net total return as of February 27, 2026. MSCI Inc.

13 FactSet Earnings Insight, S&P 500 Q4 2025 earnings season, week of February 27, 2026 (factset.com). Blended earnings growth rate of 14.2% with 96% of S&P 500 companies reporting; fifth consecutive quarter of double-digit earnings growth.