July closed as a strong month for corporate fundamentals and a bruising one for market expectations. Second-quarter earnings grew at their fastest pace since 2021, but markets became more volatile late in the month after the Federal Reserve held interest rates steady, while three policymakers dissented, arguing that rates should be raised. Long-term Treasury yields hit multi-year highs, oil surged more than 20% on renewed conflict in the Middle East, and the S&P 500’s eleven-year July winning streak ended by the narrowest of margins.
Q2 Earnings Are Real, But the Headline Number Is Not the Whole Story
Second-quarter earnings growth ranks as the S&P 500’s strongest since the third quarter of 2021, with FactSet’s blended year-over-year growth rate at 47.4% as of July 31.1 The headline figure reflects both broad-based earnings strength and two outsized contributors. Alphabet recorded a $98 billion mark-to-market gain on equity securities under Generally Accepted Accounting Principles (GAAP), driven primarily by unrealized gains on their holdings in SpaceX and Anthropic, even though they did not sell the underlying investments. Amazon’s stronger-than-expected cloud results provided a further boost when the company reported on July 31.1 Excluding those two companies, the blended earnings growth rate is 28.8%. Even with these outliers, this is an exceptional result that marks the second consecutive quarter above 20% and the seventh straight quarter of double-digit growth.
- Ten of the eleven sectors are reporting year-over-year growth: Of those ten sectors, eight are reporting double-digit earnings growth, led by Energy, Communication Services, Consumer Discretionary, Information Technology, and Materials. Health Care is the lone sector reporting a decline. Revenue growth is 12.8%, the highest since Q2 2022 and the second consecutive quarter of double-digit top-line growth. Guidance for the second half remains constructive, with more S&P 500 companies issuing positive third-quarter EPS guidance than the historical average.1
- Market breadth remains a concern despite the earnings strength: The Nasdaq-100 fell roughly 7% in July, its steepest monthly decline since March 2025, as investors questioned elevated AI-related valuations even while the underlying earnings kept beating expectations. The broader Nasdaq Composite declined 3.2% for the month, its worst monthly performance since March 2025.2
Implications for Investors: The Q2 numbers are strong on any honest reading. The 28.8% excluding Alphabet and Amazon is more representative of what the median S&P 500 company is doing and is an encouraging figure. Investors should read the headline earnings growth rate with the same care they would read a headline inflation number that includes one large volatile component. The underlying trend is what matters for portfolio construction, and by that measure earnings continue to justify constructive positioning in high-quality equities, though not at any price.
The Warsh Fed Delivers Its First Contentious Meeting
The Federal Open Market Committee held the federal funds rate at 3.50 to 3.75% at its July meeting, but the 9-3 vote was the least unified decision in years. Three regional Fed presidents dissented in favor of a 25 basis point hike, marking the first time since September 2016 three policymakers dissented in the same direction against the majority.3 The dissenters were Cleveland’s Beth Hammack, Minneapolis’s Neel Kashkari, and Dallas’s Lorie Logan. Their concerns are the ones markets have been debating for months: inflation has sat above the Federal Reserve’s 2% target for more than five years, oil prices have surged more than 20% in July as the June ceasefire with Iran collapsed, and the labor market remains solid enough that a rate hike would not immediately threaten employment.4
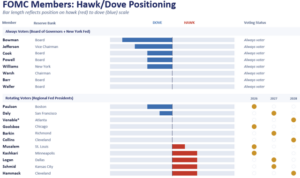
- The dissents came from the most hawkish members of the committee: The following chart shows each FOMC member’s positioning on a hawk-to-dove scale (measuring the degree to which each policymaker favors higher rates to contain inflation, versus lower rates to support employment) compiled by ITC Markets Research. Crestwood clients who tuned into our July Webinar about the Warsh Fed will note that this chart is similar to one we covered.
- As we noted in the webinar: The three July dissenters are in the hawkish camp of the committee. Their vote for a hike is consistent with their published views over the past year and not a sudden shift in their thinking. What has shifted is the willingness to publicly break with the majority. Chair Warsh has explicitly encouraged this kind of dissent, telling reporters after the meeting, “I asked for a good family fight and I got one.”5

Source: ITC Markets Research, FOMC Hawk/Dove Analysis, last updated June 26, 2026. Voting rotations reflect Federal Reserve Board records. Bar length indicates policy positioning on a scale from most dovish (blue) to most hawkish (red); gold dots indicate voting years for regional Fed presidents. *Venable is interim Atlanta Fed president following Bostic’s February 2026 resignation.
- Long-term yields rose sharply on the outcome: Chair Warsh’s press conference triggered a swift repricing in the bond market. The 30-year Treasury yield hit 5.25%, its highest mark since 2007. The 10-year yield topped 4.7%, its highest since January 2025. The Dow dropped approximately 1,150 points during the press conference as investors reassessed the Fed’s path.6 Warsh addressed the market reaction directly, saying he views it as healthy that the bond market responds to economic data rather than the Fed’s forward guidance. This is consistent with his stated philosophy that the Fed should communicate less about future policy and more about the conditions under which action would occur.6
- The market is now pricing a real chance of a hike, not just an extended pause: The CME FedWatch tool showed the probability of a September rate hold rose immediately after the July meeting. The move higher does not reflect increased confidence that the Fed will hold, but rather an increase in uncertainty. Investors are increasingly pricing in a rate hike by year-end, particularly if inflation data continues to run above target and oil prices stay elevated. The next FOMC meeting is September 15-16, following the July and August inflation reports.3 Chair Warsh will speak at the Jackson Hole Economic Policy Symposium on August 27-29, and markets will read that address carefully for any signal on how his approach may evolve heading into September.3
Implications for Investors: The hawk-dove chart is a useful reminder that the FOMC is a committee with twelve voters, each with distinct views, not a single voice. The three July dissents did not come out of nowhere; they came from members whose positions on inflation have been consistent and public for months. What is new is a Chair who welcomes public disagreement rather than suppresses it. For investors, this means Fed communication will be noisier than under the prior Chair, and the September meeting outcome is genuinely uncertain rather than telegraphed in advance. Duration risk in fixed income portfolios warrants ongoing monitoring and alignment with each individual investor’s financial goals.
Trends We Are Watching
- Small caps had their strongest first-half relative to the S&P 500 since 2001, but that lead unwound in July: The Russell 2000 led through the early part of July before giving back its gains on the Fed decision, finishing the month down roughly 3%. Small caps typically benefit from expectations of rate cuts and a broadening of market participation beyond mega-cap technology; a hawkish Fed pivot removes both tailwinds. The July reversal is a reminder that the small-cap rally is highly rate-sensitive.2
- June inflation data cooled, but the details tell a nuanced story: On July 30, the Bureau of Economic Analysis released the June reading for the Personal Consumption Expenditures (PCE) index, the Federal Reserve’s preferred inflation gauge. Headline PCE fell 0.1% month-over-month, with the year-over-year rate slowing to 3.7% from 4.1% in May. Core PCE rose just 0.1% month-over-month, with the year-over-year rate easing to 3.3% from 3.4% in May.7 June PCE moved in the right direction, but core PCE at 3.3% remains well above the Federal Reserve’s 2% target, and the June cooling was driven primarily by energy prices tied to the temporary Iran ceasefire, which has since unraveled.7
- The S&P 500’s July winning streak has ended: The S&P 500 had posted gains every July from 2015 through 2025, an 11-year streak that made July statistically the market’s strongest month over the past two decades. That streak ended last month with the S&P 500 closing down 0.1% for the month, driven by the late-month volatility around the FOMC decision and the sharp rise in long-term yields. The Nasdaq Composite fell 3.2% while the Dow gained 0.3%, its fourth consecutive monthly gain.8
The Takeaway
July’s data confirmed two things portfolio construction has been anticipating for months: corporate earnings remain strong enough to justify equity exposure, and the path of Federal Reserve policy is more contested than at any point in the current cycle. Chair Warsh explicitly said at his July 29 press conference that cooler June inflation data did not factor significantly in the decision to hold rates. This can be seen as a signal that the FOMC will need more than one favorable data point to consider easing, and a hint that July’s oil rally is likely to make the next round of CPI and PCE releases look worse rather than better. In the meantime, the case for balanced positioning across duration, quality, and geography is stronger than it was three months ago, and the case for concentrated exposure to any single theme, including AI, is more nuanced than the market has been pricing. Patience and discipline remain the right posture heading into the fall.
Returns of Market Indices | July 2026
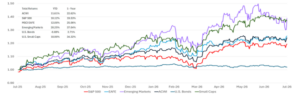
Global equities and U.S. large caps were nearly flat for the month (MSCI ACWI +0.1%, S&P 500 -0.1%).8 International developed markets (MSCI EAFE) fared better, returning +1.98%.9 Emerging market equities and U.S. small caps both declined by 3% for the month (MSCI EM Equity and Russell 2000, respectively). Fixed income sold off as long-term yields rose to multi-year highs, with the 30-year Treasury yield reaching 5.25%, its highest level since 2007, and the 10-year Treasury reaching 4.7%. The bond market finished down 1.3% for the month (Bloomberg US Aggregate Total Return Index).6 Year-to-date returns are shown in the chart below.

Past performance is not indicative of future results.
Sources
- FactSet Earnings Insight, S&P 500 Earnings Season Update: July 31, 2026, John Butters. Blended (year-over-year) Q2 2026 earnings growth rate 47.4 percent; excluding Alphabet and Amazon.com, 28.8 percent. Alphabet Q2 2026 GAAP EPS included a $98 billion mark-to-market gain on equity securities, driven primarily by unrealized gains on holdings in SpaceX and a private company (Anthropic), per Alphabet Q2 2026 filing (“primarily related to unrealized gains in our equity securities portfolio from SpaceX and a private company”). Revenue growth 12.8 percent, highest since Q2 2022. Eight of ten sectors reporting year-over-year growth are reporting double-digit growth; Health Care is the only sector reporting a decline.
- CNBC, “Stock market news for July 30, 2026,” July 30, 2026 (cnbc.com); CNBC, “.RUT Russell 2000 Index quotes and news,” accessed August 1, 2026. Nasdaq-100 declined approximately 7 percent in July 2026, the steepest monthly decline since March 2025. Russell 2000 first-half 2026 outperformance vs. S&P 500 the largest since 2001 (Charlie Bilello, Creative Planning; Franklin Templeton).
- CNBC, “Fed rate decision July 2026: Divided Fed holds interest rates steady,” July 29, 2026 (cnbc.com); Fox Business, “July FOMC: Fed holds interest rates steady,” July 29, 2026 (foxbusiness.com). FOMC voted 9-3 to hold the federal funds rate at 3.50-3.75 percent. Dissenters: Beth Hammack (Cleveland Fed), Neel Kashkari (Minneapolis Fed), and Lorie Logan (Dallas Fed), each voting for a 25 basis point hike. First time three FOMC members dissented in the same direction against a hold since September 2016. CME FedWatch: 41.9 percent probability of a September hold post-meeting, up from 24 percent one day earlier. Next FOMC meeting September 15-16, 2026.
- TradingEconomics, “Brent Crude Oil,” July 31, 2026; TradingEconomics, “Crude Oil,” July 31, 2026. Brent crude closed July 31 at approximately $88 per barrel; WTI approximately $85 per barrel. Both benchmarks rose more than 20 percent in July on renewed U.S.-Iran hostilities following the collapse of the June ceasefire.
- ITC Markets Research, FOMC Hawk/Dove Analysis, last updated June 26, 2026. Chart data: Bar length indicates each FOMC participant’s positioning on a hawk-to-dove scale, with red indicating hawkish and blue indicating dovish. CNN Business, “Two key takeaways from the Fed’s unusually unpredictable meeting,” July 29, 2026. Chair Warsh quoted: “I asked for a good family fight and I got one.”
- CNN Business, “Fed holds interest rates steady after cliffhanger meeting, but three officials dissent,” July 29, 2026. 30-year Treasury yield reached 5.25 percent (highest since 2007); 10-year Treasury yield reached 4.7 percent (highest since January 2025). Dow Jones Industrial Average declined approximately 1,150 points during Chair Warsh’s press conference on July 29, 2026. Bloomberg US Aggregate Total Return Index July 2026 return approximately -1.3 percent (Bloomberg terminal data, accessed August 1, 2026).
- U.S. Bureau of Economic Analysis, Personal Income and Outlays: June 2026, released July 30, 2026 (bea.gov). PCE price index declined 0.1 percent month-over-month in June 2026; year-over-year PCE increased 3.7 percent, down from 4.1 percent in May 2026. Core PCE (excluding food and energy) rose 0.1 percent month-over-month; year-over-year core PCE increased 3.3 percent, down from 3.4 percent in May 2026. Real personal consumption expenditures increased 0.4 percent month-over-month. Chair Warsh’s comment on the June PCE release was reported in Quartz, “June 2026 PCE inflation falls 0.1%, consumer spending up 0.3%,” July 30, 2026 (qz.com).
- TradingEconomics, “United States Stock Market Index,” July 31, 2026 (tradingeconomics.com); Bloomberg via Yahoo Finance, “S&P 500 Historical Data,” accessed August 1, 2026. S&P 500 closed July 31 at 7,489.72, down approximately 0.1 percent for the month. Nasdaq Composite closed at 25,373.85, down approximately 3.2 percent for the month. Dow Jones Industrial Average closed at 52,485.03, up approximately 0.3 percent for the month, its fourth consecutive monthly gain. S&P 500 had risen in every July from 2015 through 2025 (11-year winning streak); July 2026 was the first negative July since 2014.
- MSCI Inc. and Bloomberg terminal data, accessed August 1, 2026. MSCI EAFE Index July 2026 monthly return +1.98%; trailing 12-month total return 25.06%. MSCI EM Index trailing 12-month total return 37.04%. YTD returns as of July 31, 2026 (per embedded chart, Bloomberg terminal data): MSCI ACWI +11.61%; S&P 500 +10.12%; MSCI EAFE +12.08%; MSCI Emerging Markets +20.25%; U.S. Bonds (Bloomberg U.S. Aggregate) -0.69%; U.S. Small Caps (Russell 2000) +18.98%.