
June delivered the largest IPO in the history of the U.S. equity market. On June 11, SpaceX priced 555.6 million shares at $135 per share, raising $75 billion. Shares began trading the next day, June 12, opening at $150 and closing at $160.95, a 19% first-day gain that pushed its market capitalization above $2 trillion.1 The size of the offering is only part of the story. The mechanics of the deal, and more importantly the rule changes that surround it, will affect portfolio construction for the next several years. The three big index providers each drew a different line on whether SpaceX belongs in their benchmarks, and OpenAI and Anthropic are widely expected to follow with similar sized offerings.
Mega IPOs and What Investors Actually Get
SpaceX’s IPO valued the company at $1.77 trillion which is close to 100x its 2025 revenue of $18.67 billion while also showing a Net Loss of $4.94 billion. 1 Approximately 4.2% of the company’s total shares were sold to the public, of which roughly 30% were allocated to retail investors, an unusually high proportion for an IPO. 2 The stock hit an intraday high of $225.64 on June 16, a 67% gain from the IPO price in three trading sessions, before selling back to $147.11 on June 23, a 34% drop from the high. It closed the month around $170 and traded around $150 at the time of publication.3 Fig. 1 illustrates an observable pattern across 25 US Mega IPOs of the past 15 years.4 5
Fig 1:
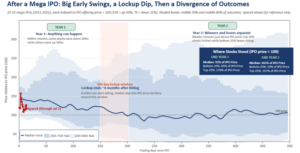
Source: Bloomberg terminal. Crestwood Advisors analysis of daily closing prices for 25 US large IPOs from 2011-2021, indexed to each company’s IPO offering price = 100 and computed empirically across the sample at each trading day. SpaceX actual path shown for reference only and is not intended to predict future performance.
- Post-IPO volatility is a documented pattern, not a SpaceX-specific phenomenon: Academic research on IPO price behavior spanning four decades finds that newly listed stocks trade with meaningfully higher volatility than seasoned stocks. Renaissance Capital data shows 30-day post-IPO volatility is approximately 45-50% higher for recent IPOs compared to seasoned stocks in the same market. A remarkable 41% of 2023 IPOs delisted within five years, with 29% attributed to poor performance.
- The lockup expiration effect is real and measurable: The standard IPO lockup which prevents insiders and pre-IPO investors from selling for the first 180 days after listing, is nearly universal. The seminal peer-reviewed study of IPO lockups, covering 2,529 firms from 1988 to 1997, found a statistically significant negative abnormal return in the trading days surrounding lockup expiration, with the effect concentrated in venture-backed technology firms.6
- The float matters more than the headline valuation: A stock’s float refers to the number of a company’s shares available for investors to trade and does not include restricted stocks held by insiders. A low float amplifies the price impact of both buying and selling pressure. With only 4.2% of SpaceX’s shares in the public float at issuance, and 30% of that allocation directed to retail investors, the available supply for institutional buyers is thin. When lockups expire, the float can expand by several multiples in a single window which could exacerbate volatility.1
Implications for Investors: Mega IPOs are not an asset every investor needs to own on day one. The academic and empirical record is consistent: first year post-IPO price divergence is wide, the lockup expiration window is associated with selling pressure, and the median mega IPO trades below its listing price for much of its first two years. For investors considering direct participation in future mega listings, patience typically rewards more than speed. Getting in early is not a guarantee of excess returns. The relevant question is not whether the company is fundamentally worth its market capitalization, but whether the current price reflects the mechanical supply-demand dynamics of a low-float IPO or the underlying business.
Index Inclusion: Who Buys, When, and How Does This Impact the Market?
The passive investing ecosystem is now large enough that index inclusion materially moves stock prices. S&P Dow Jones Indices estimated that approximately $20 trillion of investment assets were benchmarked to the S&P 500 as of December 2024, with roughly $13 trillion in passively managed assets.7 When an index adds a stock, funds tracking that index must buy it, regardless of price. The mechanics of this forced buying have become a distinct market phenomenon, and the divergence between how the major index providers approach mega IPOs will create meaningfully different exposures across benchmarks.
- Index inclusion rules diverged sharply this year:
-
- S&P Dow Jones chose to preserve its existing eligibility criteria for the S&P 500. New additions must meet a 12-month seasoning requirement, must be GAAP-profitable in the most recent quarter and cumulatively over the trailing four quarters, and must satisfy minimum public float requirements. SpaceX, which posted a $4.94 billion net loss in 2025, is not eligible for the S&P 500 until at least mid-2027, and only then if it achieves GAAP profitability.
- Nasdaq, revised their methodology to allow any newly listed company in the top 40 by market capitalization to enter the Nasdaq-100 after just 15 trading days, with no minimum float requirement.
- FTSE Russell also revised their rules and confirmed SpaceX will enter the Russell 1000 at the September or December 2026 quarterly reconstitution.
- MSCI, which has had a 10-trading-day inclusion rule since 2007, kept its existing methodology and likewise CRSP allows fast-track IPO inclusion after just 5 trading days.7 8 9
- The Tesla precedent shows the mechanics of forced buying: The most relevant recent template is Tesla’s addition to the S&P 500 on December 21, 2020. On November 16th, S&P announced Tesla would be added to the index on December 18th. Because Tesla’s weight at inclusion was approximately 1.7% of the index, passive funds tracking the S&P 500 needed to buy an estimated $50 billion to $80 billion of shares to align their portfolios with the new index composition. The actual buying was heavily concentrated in the last trading day before inclusion. Over 200 million Tesla shares traded that day, including roughly 69 million shares, worth approximately $50 billion, in the electronically managed closing auction alone. The stock’s price gyrated wildly in the final minutes as active traders who had front-run the passive buying looked to sell into the mandatory demand. The Tesla mechanic shows a pattern: an announcement, a five-week preparation window, front-running by active investors, and a concentrated buying surge on or near the effective date.10
- The buying is funded by proportional selling across the index: Index funds run essentially fully invested, with cash balances typically under 1% of assets. When a new name is added, the required purchases are funded primarily by proportional trimming of every other constituent, not by simply selling the specific name being removed to make room. When SpaceX enters the Nasdaq-100 at an estimated 0.47% to 0.70% initial weight, index funds tracking the Nasdaq-100 must reduce their positions in each of the other 100 constituents by that same proportional amount to fund the SpaceX buy. On a rough estimate, if the Nasdaq-100 tracking ecosystem needs to allocate approximately $7 billion of new capital to SpaceX at inclusion, that same $7 billion is distributed across the other 100 names as proportional selling pressure, equating to roughly $70 million of selling per constituent. Individually, that is a rounding error for the largest names, but it can be more meaningful for smaller constituents. When SpaceX eventually qualifies for the S&P 500, the same mechanic applies on a much larger scale: an estimated $50 billion or more of forced buying, funded by proportional selling across all 499 other index constituents. The forced buying story is really two stories at once: mechanical demand for the incoming name, and mechanical selling pressure diffused across everything else the index owns.7 9
- The Facebook precedent shows how long the S&P is willing to wait: Facebook went public in May 2012 at a valuation of approximately $104 billion, at the time the largest US technology IPO in history. It was not added to the S&P 500 until December 2013. The delay was partly a function of the seasoning requirement, partly the stock’s post-IPO price weakness (Facebook traded below its $38 IPO price for most of its first year), and partly the S&P Index Committee’s judgment that the social media sector did not yet require dedicated representation. S&P’s willingness to make the Facebook cohort wait is the same posture it has now taken with SpaceX, and by extension with Anthropic and OpenAI when they list.11
- Estimated forced buying: near-term and delayed: Bloomberg Intelligence estimates that passive funds tracking the Nasdaq-100 and Russell 1000 will ultimately need to acquire shares equal to approximately 24% of SpaceX’s public float, with a subsequent S&P 500 inclusion adding demand for another 19% of the float. Once actively managed funds benchmarked to those indexes are included, more than half of SpaceX’s public float becomes mechanical demand. Goldman Sachs estimates that the Nasdaq-100 inclusion alone could trigger as much as $60 billion of forced buying. The precise amounts vary across methodologies, but the broader pattern is consistent: multiple waves of mechanical buying associated with the Nasdaq-100 and Russell 1000 in 2026, followed by a substantially larger and more concentrated buying event once SpaceX becomes eligible for inclusion in the S&P 500.12 13
Implications for Investors: The Tesla precedent is instructive. In the five weeks between S&P’s November announcement and the December effective date, Tesla shares rose appreciably, reflecting both investor enthusiasm and positioning ahead of the anticipated wave of passive index buying. If similarly large companies such as SpaceX, Anthropic, or OpenAI ultimately become eligible for inclusion in the S&P 500, comparable market dynamics may emerge. Investors should expect volatility across equity markets both immediately following a mega IPO as well as during the time when each new leviathan is being purchased by index funds.
Trends We’re Watching
- Oil’s round trip: The June 17 U.S.-Iran ceasefire and reopening of the Strait of Hormuz drove one of the fastest oil price reversals on record. Brent crude peaked at $118 per barrel in April and closed June near $73, a 38% decline in ten weeks. The EIA now projects Brent averaging $70 per barrel by year-end, assuming no resumption in hostilities. There have been multiple rounds of announcements of potential resolutions to the conflict and impacts are still rippling through the global economy.14
- The Warsh Fed’s hawkish debut: Kevin Warsh’s first FOMC meeting on June 17 held the federal funds rate at 3.50% to 3.75% by a unanimous 12-to-0 vote. The June Summary of Economic Projections (aka the Dot Plot) revised the median 2026 federal funds rate up to 3.8% from 3.4% in March. Nine of 18 committee members project at least one rate hike in 2026. This implies the next move could just as easily be a hike as a cut. The FOMC statement was cut to 130 words from 341, forward guidance was removed, and Warsh announced five task forces to overhaul Fed communications, monetary policy operations, data sources, productivity analysis, and inflation measurement.15 16
- AI capex hits the consumer at the cash register: Apple raised prices on select MacBook and iPad models on June 25, with increases of up to $300 (18% to 25%) on premium configurations. Microsoft followed hours later with Xbox console price increases of $100 to $150 effective August 1. Both companies attributed the increases to memory chip costs, which have more than doubled since 2025 and are expected to double again by fall 2027 as AI data-center demand crowds out consumer electronics. The AI capex cycle we discussed in April is now feeding directly into consumer prices, and this pass-through is likely to continue for at least two more years.17
The Takeaway
Three practical takeaways emerge from the month:
First, investors should be cognizant that the newest cohort of large listings will be absent from the S&P 500 and many Quality-focused strategies until each achieves GAAP profitability. If these newcomers perform well out of the gate, this could lead to a period of short-term underperformance, particularly as retail investors and those subject to FOMO chase the latest and greatest IPO.
Second, investors considering direct participation in future mega listings should be mindful that the academic and empirical record supports patience: post-IPO paths widen before they narrow, and the median mega IPO trades below its listing price for much of its first two years. This volatile post-IPO period is where Quality investors are more likely to gain ground, favoring the newcomers who demonstrate profitable business models and avoiding companies who struggle to generate positive cash flow.
Third, investors should continue to monitor bond duration and favor higher-quality fixed income while the Fed’s hawkish posture and the additional energy-related inflation risk both remain unresolved.
Returns of Market Indices | June 2026
U.S. equities were mixed in June as post-IPO trading, cooling AI leadership, and consumer-price increases from Apple and Microsoft weighed on late-month sessions. The S&P 500 closed the month near record levels, but down slightly for the month (-1%). Global Equities were likewise slightly down (MSCI ACWI -0.8%). Developed International equities were slightly positive (MSCI EAFE +0.1%) while Emerging Market equities were down (MSCI EM Equity -1.4%). U.S. Small and Mid Caps had a strong month (Russell 2000 +3.7%). Bond investors saw a flatter curve on the day of the June FOMC meeting: the Warsh Fed’s hawkish dot plot pushed the 2-year yield higher while long-end yields moved less, though Treasuries recovered ground later in the month as oil prices retreated. Overall, this left bond prices slightly positive for the month (Bloomberg U.S. Aggregate Bond +0.24%). Year to Date returns are shown in Fig 2.
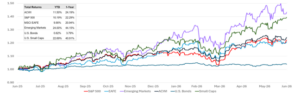
Past performance is not indicative of future results. Index returns represent total return. Source: Bloomberg.
Sources
-
SpaceX S-1 Registration Statement (SEC filing, public May 20, 2026); CNBC, “SpaceX IPO takeaways: SPCX closes at $161, jumping 19% after record debut,” June 12, 2026 (cnbc.com); TechCrunch, “SpaceX officially prices shares at $135 in the largest IPO ever,” June 11, 2026. IPO priced 555.6 million shares at $135 per share; total shares outstanding approximately 13.076 billion; first-day close $160.95 (+19.2%); market capitalization at IPO price approximately $1.77 trillion. 2025 revenue $18.67 billion; 2025 GAAP net loss $4.94 billion. Public float approximately 4.2% of shares outstanding.
-
CNBC, “SpaceX IPO explained: The price is set, but retail allocation still up in the air,” June 9, 2026 (cnbc.com). Approximately 30% of IPO shares allocated to retail investors, roughly $22.5 billion, distributed through Charles Schwab, Fidelity, Robinhood, SoFi, and E*TRADE. Typical retail IPO allocation is 5% to 10%.
-
Yahoo Finance, MacroTrends, and Investing.com historical price data for SPCX, accessed July 2, 2026. SpaceX all-time high $225.64 on June 16, 2026; all-time low $147.11 on June 23, 2026; June 30 close $170.86; July 7 close $149.47. Average daily volume approximately 80 million shares. Nasdaq-100 estimated initial weight 0.47% to 0.70% per Nasdaq index methodology.
-
Renaissance Capital IPO market data, accessed June 2026 (renaissancecapital.com). 30-day post-IPO annualized volatility for 2023 US IPOs approximately 22% vs. 15% for seasoned stocks (approximately 45% to 50% higher on a relative basis). Approximately 41% of 2023 IPOs delisted within 5 years, with 29% attributed to poor performance.
-
5. Crestwood analysis. Bloomberg terminal, daily closing prices for the first 500 trading days after IPO. Prices indexed to each company’s IPO offering price = 100. Percentile bands and median line computed empirically across the 25-stock sample at each trading day, with light smoothing applied. Final IPO prices rounded to the nearest whole percentage. Groupon prices adjusted for its 1-for-20 reverse split (June 2020); direct listings (Slack, Palantir, Roblox, Coinbase) indexed to exchange reference price. 25-stock group: Groupon (GRPN), Zynga (ZNGA), Facebook/Meta (META), Workday (WDAY), Tableau (DATA), Twitter (TWTR), Hilton (HLT), Ally Financial (ALLY), Alibaba (BABA), Snap (SNAP), Lyft (LYFT), Pinterest (PINS), Zoom (ZM), Uber (UBER), Slack (WORK), Snowflake (SNOW), Palantir (PLTR), DoorDash (DASH), Airbnb (ABNB), Bumble (BMBL), Roblox (RBLX), Coupang (CPNG), Coinbase (COIN), Robinhood (HOOD), Rivian (RIVN). SpaceX daily closing prices are shown for June 12 through July 2, 2026. SpaceX path shown for reference only and is not intended to predict future performance.
-
Field, L.C. and Hanka, G. (2001), “The Expiration of IPO Share Lockups,” Journal of Finance, 56: 471-500. Sample of 2,529 firms 1988-1997; lockup expirations associated with significant negative abnormal returns of approximately 1.5% in the immediate event window, concentrated in venture-backed firms. Ofek, E. and Richardson, M. (2000), “The IPO Lock-Up Period: Implications for Market Efficiency and Downward Sloping Demand Curves,” NYU Stern working paper. Bradley, D.J., Jordan, B.D., Roten, I.C., and Yi, H.-C. (2001), “Venture Capital and IPO Lockup Expiration: An Empirical Analysis,” Journal of Financial Research, 24: 465-493.
-
Morningstar, “The SpaceX IPO: How Index Funds Are Adapting,” June 2026 (morningstar.com). S&P Dow Jones Indices consultation results announced June 4, 2026: no changes to S&P 500 eligibility criteria. Nasdaq revised methodology effective May 1, 2026, allowing top-40-by-market-cap fast entry after 15 trading days. FTSE Russell relaxed 5% float minimum. CRSP allows fast-track inclusion after 5 trading days for eligible IPOs. MSCI retained its 10-trading-day inclusion rule (in place since 2007). S&P Dow Jones Indices estimated approximately $20 trillion indexed or benchmarked to the S&P 500 as of December 2024, with approximately $13 trillion in passive assets. Index fund methodology on cash balances and rebalancing mechanics: index funds run at cash balances typically below 1% of assets and fund new-name inclusions via proportional trimming of existing constituents.
-
CNBC, “SpaceX blocked from early U.S. benchmark index entry as S&P reaffirms existing rules,” June 5, 2026 (cnbc.com). S&P Global Ratings statement: exceptions to financial viability, seasoning, and IWF requirements will not be granted solely based on market capitalization. GAAP profitability requirement for S&P 500 inclusion unchanged.
-
Vanguard, “Stay grounded on moonshot IPOs,” June 8, 2026 (corporate.vanguard.com). Comparative summary of index provider approaches to mega IPOs and index fund rebalancing mechanics. Charles Schwab, “Some Indexes Accelerate Entry for Massive IPOs,” June 2026 (schwab.com). Both sources describe the standard practice of funding new-name index inclusions through proportional selling of existing constituents rather than through cash balances or single-name replacement.
-
S&P Dow Jones Indices press release, “S&P Dow Jones Indices Announces Changes to the S&P 500 Index,” November 16, 2020. Forbes, “Will Tesla Break The S&P 500? (Part 2): The Mechanics Of Market Turmoil,” January 4, 2021; Forbes, “Will Tesla Break The S&P500? (Pt 3): Did The Way It Was Added Help Create A Bubble?,” January 10, 2021. Tesla added to S&P 500 effective December 21, 2020 in a single-step addition. Approximately 69 million shares (~$50 billion) traded in the closing auction on December 18, 2020; total daily volume exceeded 200 million shares. Weight at inclusion ~1.7% of index. Front-running dynamics drove Tesla shares up approximately 70% between the November 16 announcement and the December 21 effective date.
-
S&P Dow Jones Indices announcement, December 11, 2013. Facebook added to S&P 500 effective December 20, 2013, approximately 19 months after its May 18, 2012 IPO. Facebook IPO priced at $38 per share; traded below $38 for most of its first year post-listing.
-
CME Group, “The SpaceX Mega-IPO: Why Index Choice Matters,” June 2026 (cmegroup.com) citing Bloomberg Intelligence estimates. Bloomberg Intelligence estimated combined Nasdaq-100 and Russell 1000 fund inclusion would absorb approximately 24% of SpaceX’s public float; subsequent S&P 500 inclusion, when it eventually applies, would add another 19%. Fortune, “If S&P Dow Jones rewrites its listing rules SpaceX and Anthropic will benefit, investors won’t,” June 2, 2026 (fortune.com), citing Goldman Sachs analyst estimates.
-
Goldman Sachs Group research, cited in Fortune (June 2, 2026) and multiple financial press reports. Estimated Nasdaq-100 fast-entry methodology change could trigger up to $60 billion in aggregate forced buying across the Nasdaq-100 tracking ecosystem for large mega-cap IPOs.
-
Capital.com and Reuters coverage of U.S.-Iran ceasefire, June 16-17, 2026; U.S. Energy Information Administration, Short-Term Energy Outlook, June 2026 (eia.gov). U.S.-Iran ceasefire signed June 17, 2026 including 60-day truce and agreement to reopen Strait of Hormuz. Brent crude fell from approximately $118 (April peak) to approximately $73 by end of June 2026, a decline of ~38%. EIA projects Brent averaging approximately $70/bbl by year-end 2026.
-
Federal Reserve, FOMC Statement, June 17, 2026; Federal Reserve, Summary of Economic Projections, June 17, 2026 (federalreserve.gov). Federal funds rate held at 3.50%-3.75% by 12-to-0 vote (unanimous). Median 2026 federal funds rate projection revised to 3.8% (from 3.4% in March). Median 2026 PCE inflation projection revised to 3.6% (from 2.7%). Nine of 18 participants project at least one rate hike in 2026. Statement length reduced to 130 words from 341 in April statement.
-
CNBC, “June FOMC: Fed holds interest rates steady as Warsh era begins,” June 17, 2026 (cnbc.com); Franklin Templeton, “June FOMC recap: It’s task force time,” June 18, 2026. Chair Warsh declined to submit his own dot to the SEP. Warsh announced five task forces to review Fed communications, monetary policy operations, data sources, productivity, and inflation measurement.
-
Bloomberg, “Apple, Microsoft Raise iPad, Xbox Prices as AI Demand Drives Costs Higher,” June 27, 2026 (bloomberg.com); Wall Street Journal interview with Tim Cook, June 17, 2026 (wsj.com); Reuters coverage, June 25-26, 2026. Apple raised MacBook and iPad prices by up to $300 (18% to 25%). Microsoft raised Xbox prices by $100 to $150 effective August 1, 2026. Memory chip costs have more than doubled since 2025 and expected to double again by fall 2027. Apple shares fell approximately 6% on the announcement.