

Markets have risen after every midterm since 1950. The planning around the portfolio is where elections actually matter.
The country votes on Tuesday, November 3. Prediction markets heading into the final week placed the odds of Democrats winning the House at 91% and the Senate at 65%.1 In every election cycle, clients ask: should the portfolio be adjusted based on how the vote goes? October gave us a fresh round of re-accelerated inflation data and a weakening labor market. Against that backdrop, the most useful context we can share this month is the historical record on midterms and markets, and the planning items that genuinely change when control of Congress changes.
October in Brief
The Federal Open Market Committee held the federal funds rate at 3.75% to 4% in a 10 to 2 vote.2 Cleveland Fed President Beth Hammack and Governor Lisa Cook dissented in favor of a 0.25% hike, a reversal from September’s unanimous vote to raise rates. Chair Warsh said policymakers are “interrogating reality” when assessing conditions, acknowledged inflation has run above target for close to six years, and stated that “politics played no role” in the committee’s decision.2 This was validated in monthly releases from several key measures of September vs August: Core Personal Consumption Expenditures (PCE) was 3.1% vs 3.0%, headline PCE was 3.6% vs 3.4%3 and CPI showed headline inflation at 3.7% year-over-year and core at 2.6%, both up from August.4 September payrolls, were also weaker than expected at +29,000, with the unemployment rate rising to 4.2%.5 As of month end, the CME FedWatch tool indicated an 82.6% probability of a 0.25% hike at the December meeting.
- A structural change to the FOMC calendar: Chair Warsh also announced at the October meeting that the Fed will phase in a new FOMC schedule starting in 2027. While the committee will hold the same number of meetings, at least one meeting will be set aside for broader monetary policy deliberations rather than a rate decision, resulting in seven rate decisions on the 2027 calendar instead of eight.6 Warsh framed the change as reserving time for strategic discussions rather than reacting to incoming data on a six-week cadence.
Implications for Investors: Investors should be prepared for a hike that could extend the cycle or for a hold that would signal the committee is more divided than markets believe today. The practical consequence of the change in FOMC voting is that each voting meeting carries slightly more weight, with any intra-meeting change implying that the FOMC felt compelled to act urgently, which would imply a more fragile economic backdrop.
What History Says About Midterms and Markets
The historical record on midterm elections and the stock market is remarkably consistent and often misunderstood. The headline finding is that since 1950, the S&P 500 has risen in the twelve months following each of the past 19 midterm elections, with an average 12-month price return of 16.6%.7 While the future is never certain, it is noteworthy that every midterm has been followed by positive S&P 500 returns over the next year under every combination of party control, every rate environment, and every geopolitical backdrop since the Korean War.
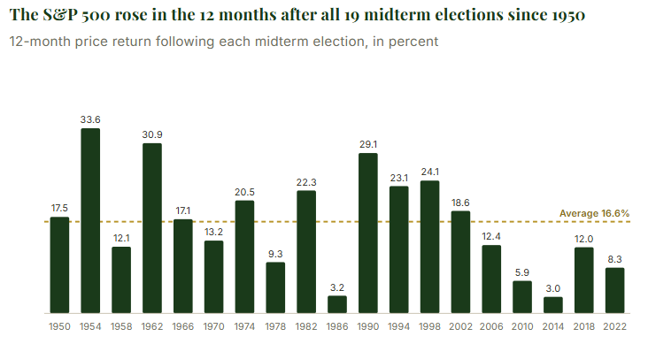
Source: BNY Investments, S&P 500 price return in the 12 months after each U.S. midterm election, 1950 through 2022, as of May 2026. Past performance is no guarantee of future results. Indices cannot be invested in directly.
- The specific scenario investors are asking about: A reasonable follow-up question is whether that record holds in the specific case where the President’s party loses control of one or both chambers of Congress, which is the base case prediction markets are pricing heading into November 3. An analysis by Horizon Investments using Bloomberg data covers that case directly. Across the eight midterms since 1950 in which the President’s party lost control of at least one chamber, the S&P 500 averaged a 12.8% total return in the following 12 months, versus 15.1% across all midterms over the same period.8 The two sets of outcomes are statistically similar, and both are positive. Divided government, in the data, has not been bad for stocks.8
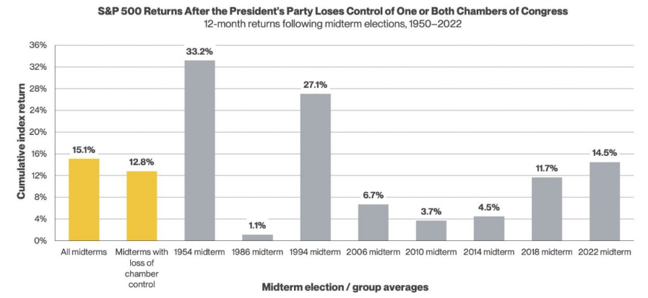
Source: Bloomberg, calculations by Horizon Investments, data as of August 30, 2026.
- The seasonal pattern around midterms: A second observation, drawn from BlackRock’s analysis of midterm years since 1970, is that S&P 500 total returns in the six months before and after a midterm election have averaged 14.1%, versus 5.7% for the same six-month windows in non-midterm years.9 The pattern reflects the market’s tendency to climb a wall of worry into election uncertainty and relieve pressure once the result is known. It does not depend on which party wins.9
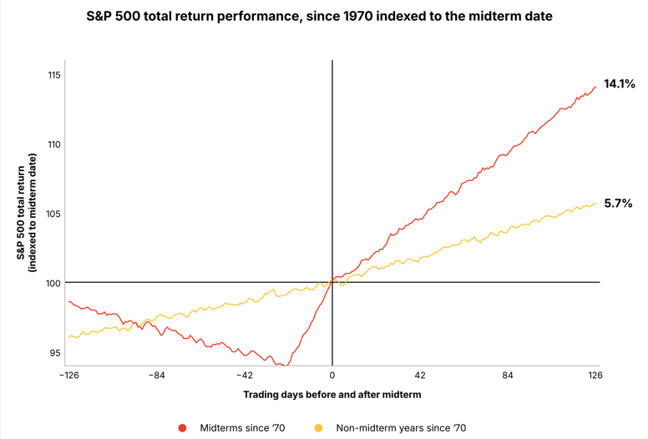
Source: Crestwood Advisors based on BlackRock and Bloomberg, data as of August 13, 2026. Based on average S&P total return since 1970 indexed to election dates or hypothetical election dates. Midterm years as follows: 1970, 1974, 1978, 1982, 1986, 1990, 1994, 1998, 2002, 2006, 2010, 2014, 2018, 2022. The “0” on the x-axis represents the Midterm/Presidential election date, which falls on the first Tuesday in November. In non-election years, hypothetical election dates were used. Month approximations based on average of 21 trading days in a month. Y-axis numbers represent total return of approximately 6 months before and after a midterm indexed to midterm date, with the value of the midterm date being 100.
Implications for Investors: Historical data shows three useful trends:
- The twelve months following a midterm election have been positive in every case since 1950.
- Divided government did not change results.
- The six months around a midterm have historically outperformed the six months around any other date.
None of this means the next twelve months are guaranteed to be positive. It does mean that the historical record offers no empirical reason to reduce equity exposure based on anticipated election outcomes, and it offers several reasons to be cautious about doing so.
Where Elections Actually Change the Math: The Planning, Not the Portfolio
While elections rarely change what a diversified portfolio should hold, they can meaningfully influence financial planning decisions as policy takes shape. Over the last 25 years, major pieces of tax and retirement legislation have moved under both unified and divided control of Congress, and each one has required a corresponding set of decisions in client financial plans. The last several decades offer a direct record of what to watch for.
- EGTRRA (2001) and the first long reset of the estate exemption: The Economic Growth and Tax Relief Reconciliation Act of 2001, signed under a Republican administration with Republican House and Senate majorities, raised the federal estate tax exemption from $675,000 in 2001 to $3.5 million by 2009, cut the top estate tax rate from 55% to 45%, and set the law to sunset at the end of 2010.10 The sunset created a one-year repeal of the estate tax in 2010 and forced families and planners to redo gifting and bypass trust strategies several times over the decade as the exemption climbed and the law’s expiration approached. The portfolio recommendation did not change but the planning recommendation changed every year.10
- The Pension Protection Act (2006): Roth conversions open, QCDs begin: The Pension Protection Act of 2006, enacted with bipartisan support in a divided Washington, created the qualified charitable distribution (QCD) from IRAs that is now a central tool in retirement income planning for charitably inclined clients. It also set the stage for the removal of the $100,000 income limit on Roth conversions, which took effect in 2010.11 Neither change impacted what the underlying IRA should hold. Both changed the planning recommendations for an IRA across an investor’s retirement, rather than the account’s investments.11
- ATRA (2013) and the permanent $5 million estate exemption: The American Taxpayer Relief Act of 2012, signed on January 2, 2013 under a Democratic administration with a Republican House and a Democratic Senate, made the $5 million estate exemption permanent and indexed it to inflation, raised the top rate from 35% to 40%, and preserved portability of the exemption between spouses.12 For the next five years, that framework governed estate planning. Families who had completed large gifts in 2012 anticipating a cliff back to $1 million needed to reassess their plans. Those who had delayed could resume with a stable set of rules.12
- TCJA (2017) and the exemption roughly doubled: The Tax Cuts and Jobs Act of 2017, enacted under unified Republican control, lowered individual rates, roughly doubled the standard deduction, created a $10,000 cap on state and local tax deductions, introduced the 20% qualified business income deduction (QBI), and more than doubled the estate and gift tax exemption to $11.18 million per person for 2018, indexed for inflation.13 The individual provisions were scheduled to sunset at the end of 2025, which meant every family with an estate approaching the old exemption had an eight-year window to use the increased amount or risk losing it. The SALT cap drove changes in state of residence considerations for high-income clients. The QBI deduction changed entity structure analysis for business owners. Once again, the portfolio did not need to change, and the primary impact was on financial planning, with changes affecting different areas of gifting, estate, and business taxes.13
- The SECURE Act (2019) and SECURE 2.0 (2022) rewrote retirement rules: The SECURE Act, passed with bipartisan support under a divided Congress in December 2019, moved the required minimum distribution age from 70½ to 72 and replaced the “stretch IRA” with a 10-year payout requirement for most non-spouse heirs.14 SECURE 2.0, enacted in late 2022, pushed the RMD age to 73 immediately and to 75 for those born in 1960 or later, expanded catch-up contributions, and introduced a new mandatory Roth catch-up for higher earners starting in 2026. Neither law changed what an IRA should hold, but both substantially changed how to coordinate withdrawals, Roth conversions, and beneficiary strategies.14
- The One Big Beautiful Bill Act (2025) extended TCJA and raised the exemption again: The One Big Beautiful Bill Act, signed July 4, 2025 under unified Republican control, made the TCJA individual rates permanent, added a temporary $6,000 deduction for taxpayers age 65 and older for 2025 through 2028, raised the estate and gift tax exemption to $15 million per person starting in 2026, restored permanent 100% bonus depreciation for property acquired after January 19, 2025, and made the 20% qualified business income deduction permanent.15 Each of those changes requires a planning decision. The portfolio question is unchanged.15
Implications for Investors: The common thread across all six laws is that each one changed what to do around the portfolio, not what the portfolio should own. Roth conversion timing, asset location across taxable and tax-advantaged accounts, the sequencing of qualified charitable distributions, when a business should purchase equipment, how a pass-through entity should be structured, whether an existing estate or gifting plan still accomplishes what it was written to accomplish, and whether beneficiary designations align with current RMD rules are the decisions that move with the tax code. The investment portfolio stayed diversified across stocks and bonds, and broad geographies through each of those administrations and each of those laws. That is the right place to let politics guide financial decisions: in the planning, not in the portfolio.
The Takeaway
The midterm election arrives against a backdrop of inflation that reaccelerated in September, a softening labor market, and a historical record that argues decisively against portfolio changes based on anticipated election outcomes. The twelve months after every midterm since 1950 have been positive for the S&P 500, regardless of whether the President’s party retains control. What does change with a shift in Congress is the tax and retirement planning landscape that sits around the portfolio. We remain cautiously optimistic as we look ahead, while expecting continued volatility along the way, and we will be closely watching for planning items that may result from legislative changes in the coming year.
Returns of Market Indices | October 2026
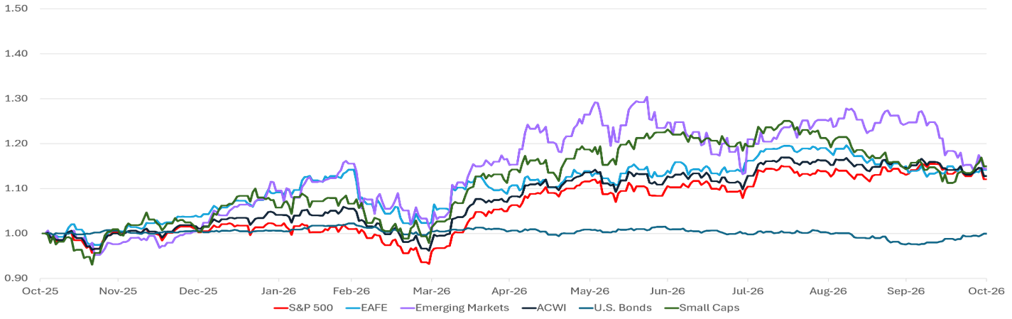
Markets were mixed in October, with performance varying considerably across regions and asset classes, with equities broadly dipping. Global equities (MSCI ACWI) declined 1.6% for the month, while U.S. large caps (S&P 500) held up comparatively, falling 0.9%. Developed international equities (MSCI EAFE) also edged lower, declining 0.7%, while emerging market equities (MSCI EM) experienced the steepest decline, dropping 8.0%. U.S. small-cap equities (Russell 2000) posted a modest gain of 0.6%, outperforming most other equity markets. Fixed income provided a positive offset, as the Bloomberg U.S. Aggregate Bond Index gained 2.4% during the month.
Source: Bloomberg. EAFE is MSCI EAFE Index, Emerging Markets is MSCI Emerging Markets and U.S. Bonds is Bloomberg U.S. Aggregate Bond Index. ACWI is the MSCI ACWI Index. Small Caps is the Russell 2000 Index. S&P 500 is the S&P 500 Index. The above information is as of 10/30/2026. Past performance is not indicative of future results.
Sources
- Kalshi, 2026 Midterm Predictions, as of October 28, 2026 (news.kalshi.com). Kalshi event-contract market odds as of October 28, 2026: Democrats to control the U.S. House of Representatives 91%; Democrats to control the U.S. Senate 65%. Prediction market pricing fluctuates; figures reflect a point-in-time reading.
- Fox Business, “October FOMC: Federal Reserve holds rates steady ahead of election,” October 28, 2026 (foxbusiness.com); Yahoo Finance, Fed meeting live coverage, October 28, 2026. FOMC voted 10-2 to hold the target range for the federal funds rate at 3.75-4.00%. Dissenters: Cleveland Fed President Beth Hammack and Federal Reserve Governor Lisa Cook, each voting for a 25 basis point hike. Chair Warsh direct quotations: “interrogating reality” when assessing conditions; “politics played no role” in the decision. CME FedWatch tool implied probability of a 25 basis point hike at the December 8-9, 2026 FOMC meeting of 82.6% as of October 28, 2026.
- U.S. Bureau of Economic Analysis, Personal Income and Outlays, September 2026, released October 29, 2026 (bea.gov). Headline PCE price index +0.5% month-over-month, +3.6% year-over-year, up from +3.4% in August. Core PCE +0.3% month-over-month, +3.1% year-over-year, up from +3.0% in August.
- U.S. Bureau of Labor Statistics, Consumer Price Index Summary, September 2026, released October 14, 2026 (bls.gov/news.release/cpi.nr0.htm). Headline CPI +0.6% month-over-month seasonally adjusted, +3.7% year-over-year, up from 3.4% in August. Core CPI +0.3% month-over-month, +2.6% year-over-year, up from 2.4% in August.
- U.S. Bureau of Labor Statistics, Employment Situation Summary, September 2026, released October 3, 2026 (bls.gov/news.release/empsit.nr0.htm). Total nonfarm payroll employment rose by 29,000 in September 2026. Unemployment rate 4.2%, up from 4.1% in August.
- Bloomberg, “Fed to Phase In New FOMC Meeting Schedule Starting Next Year, Warsh Says,” October 28, 2026 (bloomberg.com); Yahoo Finance, “The Fed just removed a 2027 rate decision — making the remaining 7 even more important,” October 29, 2026. Chair Warsh announced at the October 28, 2026 FOMC meeting that beginning in 2027 the FOMC will reserve at least one of its eight scheduled meetings for broader monetary policy deliberations rather than a federal funds rate decision, reducing the number of scheduled rate decisions on the 2027 calendar to seven. Chair Warsh direct quotation: policymakers will “reserve the time and space as an intellectually diverse group for strategic deliberations.”
- BNY Investments, “The S&P 500 rose in the 12 months after all 19 midterm elections since 1950,” chart data as of May 2026 (bny.com). S&P 500 price return in the 12 months following each U.S. midterm election from 1950 through 2022; the index rose in each of the 19 observations; average 12-month price return 16.6%.
- Horizon Investments, “The 2026 Midterms: What Does History Tell Us?” using Bloomberg data as of August 30, 2026 (horizoninvestments.com). S&P 500 returns in the 12 months following midterm elections, 1950-2022: all-midterm average 15.1%; average for midterms in which the President’s party lost control of one or both chambers of Congress 12.8%. 1954 midterm: 33.2%; 1986 midterm: 1.1%; 1994 midterm: 27.1%; 2006 midterm: 6.7%; 2010 midterm: 3.7%; 2014 midterm: 4.5%; 2018 midterm: 11.7%; 2022 midterm: 14.5%.
- BlackRock, “2026 Midterm Elections and Market Performance,” using Bloomberg data as of August 13, 2026 (blackrock.com). S&P 500 total return performance since 1970 indexed to midterm date. Average total return approximately 14.1% in the six months around midterm elections, versus approximately 5.7% in equivalent six-month windows in non-midterm years. Based on average S&P total return since 1970 indexed to election dates or hypothetical election dates in non-midterm years.
- Lathrop GPM, “History and Outlook of the Federal Estate Tax” (lathropgpm.com). Economic Growth and Tax Relief Reconciliation Act of 2001: federal estate tax exemption raised from $675,000 in 2001 to $3.5 million by 2009; top estate tax rate reduced from 55% to 45%; estate tax repealed for 2010 only under the law’s sunset provision.
- Pension Protection Act of 2006, Public Law 109-280, signed August 17, 2006 (congress.gov); Fidelity, “Tax-Saving Measures from the Pension Protection Act of 2006.” The Act created the qualified charitable distribution (QCD) from IRAs, initially temporary and later made permanent, allowing certain IRA owners age 70½ or older to make tax-free charitable transfers directly from an IRA. The Act also contributed to the subsequent elimination of the $100,000 adjusted gross income limitation on Roth conversions, effective January 1, 2010.
- American Taxpayer Relief Act of 2012, signed January 2, 2013; Lathrop GPM, “History and Outlook of the Federal Estate Tax.” The Act set the federal estate and gift tax exemption at $5 million per person on a permanent, inflation-indexed basis; raised the top estate and gift tax rate from 35% to 40%; and preserved portability of the exemption between spouses.
- Tax Cuts and Jobs Act of 2017, Public Law 115-97, signed December 22, 2017. Individual rate reductions; standard deduction approximately doubled; $10,000 cap on state and local tax deductions; 20% qualified business income deduction under Internal Revenue Code Section 199A; federal estate and gift tax exemption raised to $11.18 million per person for 2018, indexed for inflation. Individual provisions originally scheduled to sunset December 31, 2025.
- SECURE Act (Setting Every Community Up for Retirement Enhancement Act of 2019), Public Law 116-94, signed December 20, 2019; SECURE 2.0 Act of 2022, Public Law 117-328, signed December 29, 2022. SECURE Act raised the required minimum distribution age from 70½ to 72 and replaced the stretch IRA with a 10-year payout rule for most non-spouse beneficiaries. SECURE 2.0 Act raised the RMD age to 73 effective January 1, 2023, and to 75 effective January 1, 2033 for individuals born in 1960 or later; expanded catch-up contribution limits; and required Roth treatment for catch-up contributions by higher-income participants effective in 2026.
- Pullman & Comley summary of the One Big Beautiful Bill Act, signed July 4, 2025. Permanent extension of 2017 Tax Cuts and Jobs Act individual rate structure; temporary $6,000 deduction for taxpayers age 65 and older applicable to tax years 2025 through 2028; federal estate and gift tax exemption raised to $15 million per person effective 2026, with inflation indexing thereafter; permanent restoration of 100% bonus depreciation for qualified property acquired after January 19, 2025; permanent extension of the 20% qualified business income deduction.