Planning for Long-Term Care

Long-term care is one of the most significant financial risks facing families, yet it is often overlooked. As life expectancies increase, and medical advances allow people to live longer with chronic conditions, the likelihood increases that an individual eventually will require some form of long-term care. A study by the US Dept. of Health and Human Services found that 70% of adults who survive to age 65 develop severe LTSS needs before they die and 48% receive some paid care over their lifetime.1

Now, more than ever, it is prudent to have a long-term care strategy that evaluates potential care needs, estimates costs, and weighs potential funding options.

What is Long-Term Care and How Much will it Cost?

Long-term care typically includes assistance with “activities of daily living” such as bathing, dressing, eating, and mobility, as well as supervision for cognitive conditions such as dementia. Care may be provided at home, in assisted living communities, or in skilled nursing facilities.

Cost is key because care services can be expensive and are generally not covered by traditional health insurance or Medicare. The cost of long-term care varies widely depending on the type of care and geographic location. In many parts of the United States, home health aides may cost $25 to $35 per hour, assisted living communities may cost $5,000 to $7,000 per month, and nursing home care can exceed $100,000 per year.2 As you plan ahead, it’s important to note that these costs tend to increase faster than general inflation due to rapidly rising labor and healthcare expenses.

Because care needs may last several years, the total financial exposure can be significant. Some individuals require only short-term care following a medical event, while others, particularly those with cognitive decline, may need care for many years. For those who enter assisted living, the average stay in a nursing home is about 485 days, or a little over a year, according to a report by the Department of Human Services and the National Center for Health Statistics.3

Timing is Everything

An important step in long-term care planning is addressing the issue well before care is needed. Waiting until retirement or until health conditions emerge can significantly limit available options. Insurance premiums rise with age, and pre-existing health issues may make individuals ineligible for coverage.

It’s recommended that family members begin evaluating long-term care planning options in their mid-50s to early 60s. At this stage of life, most people are still healthy enough to qualify for insurance, yet close enough to retirement to realistically evaluate their financial resources and goals.

Starting early also allows families to incorporate long-term care considerations into a broader financial plan that includes retirement income, investment strategy, estate planning, and tax planning. Think about how you want to age; do you want to stay at home, go into assisted living, or live in a community?

Is Long-Term Care Insurance the Right Choice?

Long-term care insurance was originally developed to help individuals protect their savings from the potentially high costs of extended care. Traditional policies typically pay a daily or monthly benefit toward qualifying care expenses once the policyholder meets certain conditions, such as needing assistance with multiple activities of daily living.

However, the long-term care insurance market has evolved over the past two decades. Premiums have increased for many policies due to higher-than-expected claims and lower investment returns for insurers. As a result, fewer companies offer traditional policies today, and consumers must evaluate coverage carefully.

Despite these changes, long-term care insurance remains an effective solution for many households, particularly those with moderate to substantial assets who wish to protect their retirement savings from a potentially large medical expense.

The Hybrid Option

In response to concerns about traditional long-term care insurance, many insurers now offer hybrid policies that combine long-term care coverage with life insurance or annuity products. These policies typically allow policyholders to access a portion of the death benefit to pay for long-term care expenses if needed. If care is never required, beneficiaries receive the remaining death benefit.

Hybrid policies address one of the most common objections to traditional long-term care insurance – the fear of paying premiums for something you may never use. While hybrid policies often require larger upfront premiums, they provide more certainty about the value of the benefits.

For individuals who have accumulated significant savings and want both asset protection and estate planning flexibility, hybrid policies can be an attractive option.

When Does Self-Funding Make Sense?

Long-term care insurance is not necessarily appropriate for every family. Some households may be better served by self-funding potential care expenses. This approach involves intentionally setting aside a portion of retirement assets to cover possible care costs.

Self-funding may be appropriate for individuals with substantial wealth who can comfortably absorb several years of care expenses without jeopardizing their lifestyle or legacy goals. In these situations, insurance premiums may represent an unnecessary cost.

However, self-funding requires discipline and realistic planning. Families should estimate potential care costs, consider inflation, and ensure that sufficient resources remain available even if care expenses occur late in retirement.

Staying Flexible

One of the challenges of long-term care planning is the uncertainty surrounding future needs. It is impossible to predict whether care will be required, what type of care will be necessary, or how long it may last. For this reason, flexibility is key.

Some families combine strategies. For example, purchasing a modest insurance policy to cover potential expenses while reserving personal assets for additional costs. Others may rely on investment income and home equity as part of their care funding strategy.

Whatever the care strategy, regularly reviewing long-term care plans is important. As financial circumstances change, families may adjust their coverage levels, asset allocation, or care preferences.

Legislative Changes

Some states have begun considering statewide payroll taxes to help fund long‑term care and other state‑run programs. Washington was the first to implement such a measure, introducing a mandatory 0.58% payroll tax on all W‑2 employees with no income cap to support its program. The only way to be exempt from this tax was to purchase private long‑term care insurance before November 1, 2021. California, New York, Minnesota, and Illinois are actively developing or evaluating similar legislation, with several other states exploring related initiatives.

Integrating Long-Term Care into a Comprehensive Financial Plan

Whether individuals choose insurance, self-funding, or a combination of both, long-term care planning should be integrated into a broader financial strategy. Retirement income projections should incorporate potential healthcare costs, and investment portfolios may need to include liquid assets that can be accessed if care becomes necessary.

Estate planning also plays an important role. Legal documents such as durable powers of attorney, healthcare proxies, and advance directives help ensure that trusted individuals can make decisions if a person becomes unable to manage their affairs. These documents can also clarify preferences regarding the type of care and living arrangements desired.

Keeping the Goal in Mind

Long-term care planning is ultimately about maintaining independence, dignity, and financial stability in later life. By considering potential care needs early and evaluating the available funding strategies, families can avoid making difficult decisions during a time of crisis.

A proactive plan, whether through insurance, self-funding, or a combination of both, provides peace of mind that resources will be available if care becomes necessary. It also allows families to focus on enjoying retirement, knowing that an important financial risk has been addressed.

If you are not yet a Crestwood client, we welcome the opportunity to connect and support you, contact us.

Sources:
  1. US. Department of Health and Human Services, ASPE, What Is the Lifetime Risk of Needing and Receiving Long-Term Services and Supports? April 2019.
  2. Carescout.com,“Calculate the cost of long-term care near you,” updated March 3, 2026 (carescout.com). Actual costs may vary by location, provider, and level of care required.
  3. Care.com, Wendy Wisner, “How Long Is the Average Nursing Home Stay?” updated August 19, 2025 (care.com).

Crestwood Advisors Named Once Again to USA TODAY’s 2026 Best Financial Advisory Firms List

BOSTON (April 17, 2025) – Crestwood Advisors (“Crestwood”), a boutique investment advisory and wealth management firm based in Boston with offices in Connecticut and Rhode Island, is proud to announce it has once again been named to the USA TODAY list of the Best Financial Advisory Firms in the U.S. for 2026.

This national list highlights firms demonstrating sustained growth, industry credibility and a strong commitment to client service in an increasingly competitive advisory landscape.

“To be recognized by USA TODAY once again is especially meaningful,” said Crestwood President and Managing Partner Leah R. Sciabarrasi, CFP®. “Consistency matters in our business – not just in performance, but in how we show up for clients. This recognition reflects our team’s commitment to building long-term relationships, navigating complexity alongside our clients, and delivering advice that adapts as their lives and priorities evolve.”

The USA TODAY Best Financial Advisory Firms list, developed in partnership with market research firm Statista, ranks the top 1,000 Registered Investment Advisors (RIAs) across the U.S. Firms are evaluated based on both short- and long-term growth in assets under management (AUM), as well as the number of recommendations received from clients and peers. Advisors are also grouped into four categories based on firm size, ranging from under $500 million to over $5 billion in assets.

Crestwood’s continued inclusion reflects its ability to maintain momentum while staying grounded in a client-first philosophy – helping individuals and families navigate complexity with clarity, discipline and a long-term perspective.

Crestwood did not pay a fee to be considered for or included on the list.


###


About Crestwood Advisors
Crestwood Advisors is an independent, fee-only, wealth management firm with approximately $8.02 billion in assets under management as of December 31, 2025. Founded in 2003, Crestwood Advisors provides investment management with financial planning strategies to help high-net-worth individuals and families identify and prioritize their goals and build sustainable wealth so that they may enjoy more financially secure and purposeful lives. For more information, please visit https://www.crestwoodadvisors.com.

April 2026 Economic and Market Update: Geopolitics at the Forefront

The U.S.-Iran conflict escalated in late February, shifting from a geopolitical risk to a real supply disruption. Markets responded with a broad risk-off move across equities and bonds.

The Strait of Hormuz and the Energy Shock

On March 4, Iranian forces declared the Strait of Hormuz closed, restricting tanker traffic through a waterway that carried roughly 20 million barrels of oil per day as of 2024, representing approximately 27% of global maritime petroleum trade.1 The commercial shipping community responded immediately: insurers withdrew coverage and major oil companies halted transits. Brent closed above $100 per barrel on March 12, the first time since August 2022.2 The International Energy Agency characterized the disruption as the largest in the history of the global oil market.3

  • The scope of the selloff: March’s selloff was broad-based, with most sectors declining and only Energy posting a meaningful gain. The S&P 500 returned -4.3% in the first quarter, but index-level results still diverged sharply: the Russell 1000 Growth Index fell 9.8%, while the Russell 1000 Value Index rose 2.1%. That gap was driven largely by index composition, as value benchmarks benefited from their heavier exposure to Energy. However, the dominant impulse across the market overall was macro de-risking, not rotation.4
  • Treasury yields increased: Treasury yields rose sharply throughout the month. The 10-year U.S. Treasury yield closed near 4.43% as of March 27, up materially from its February month-end level of 4.15%, while the 2-year yield rose in parallel as investors pared back expectations for near-term Fed cuts.5
  • The supply architecture: OPEC+ holds approximately 3.5 million barrels per day of spare capacity, concentrated in Saudi Arabia and the UAE, but a significant portion of that capacity cannot reach global markets if the Strait remains inaccessible. Saudi Arabia and the UAE moved quickly to reroute oil via overland pipelines, and the International Energy Agency coordinated an emergency stock release that could approach 3 million barrels per day. These measures provide a partial buffer, characterized as stop-gap solutions rather than structural offsets. Importantly, the strait remains the bottleneck and overland pipeline capacity covers only a fraction of normal volumes.3, 6

Implications for Investors: The near-term inflation impact is real: U.S. gas prices rose approximately $0.60 per gallon in the two weeks following the start of the conflict, and Bloomberg Economics estimated March CPI at 3.4% year-over-year, up from 2.4% in February. The medium-term economic impact depends almost entirely on how long the Strait remains disrupted. Combined with slower job growth and sluggish wage increases, higher energy costs are likely to hurt lower-income consumers. This volatility is a reminder that while geopolitical risk can never be avoided entirely, there are tangible benefits to being diversified across sectors, geographies, and asset classes.

The Fed: Holding Course While the Map Changes

The Federal Open Market Committee met on March 17 and 18 and voted 11 to 1 to hold the federal funds rate unchanged at 3.50% to 3.75%.7 The decision was widely anticipated. What made the meeting notable was what the committee said, not what it did. The FOMC statement explicitly acknowledged that developments in the Middle East create uncertainty for the U.S. economy, a direct insertion of the conflict into the official policy framework. Chair Powell summarized the committee’s posture with characteristic plainness: the Fed simply does not yet know what the economic consequences of the conflict will be.

  • The inflation data (before the shock): February CPI came in at 2.4% year-over-year, matching January’s 2.4% and down from 2.7% in December 2025, and core CPI rose 2.5%. Those readings were constructive. The energy-driven inflation shock that began in early March will not fully appear in official data until April and May releases.10
  • Updated projections: The March Summary of Economic Projections (aka the “Fed’s Dot Plot”) revised inflation projections upward, with the median Personal Consumption Expenditure (PCE) inflation forecast for 2026 increasing 0.3% to 2.7%, the largest single-year upward revision in recent memory. The median projected federal funds rate for year-end 2026 remains at 3.4%, implying one additional 25-basis-point cut over the remainder of the year.7, 8
  • Shifting Expectations: Before the conflict, futures markets were pricing two rate cuts in 2026 with a small probability of a third. By month-end, the consensus had collapsed to at most one cut, with CME FedWatch showing a meaningful probability of no cut at all this year. Seven of 19 FOMC participants indicated in the dot plot that they expect rates to stay unchanged through year-end, one more than in December.7, 9

Implications for Investors: The Fed’s current position is genuinely uncomfortable: headline inflation is heading higher in the near term due to energy prices, growth data is softening, and the committee has limited room to act in either direction without signaling something it does not intend. The Fed tends to watch Core inflation, which excludes often-volatile energy and food prices, because it is a better gauge of persistent price trends. During periods of sharply rising energy prices, like today, the Fed will be watching Core inflation to see if this results in higher costs in other goods and services.

A disruption that resolves quickly would allow the committee to resume its easing path and reassure bond markets. Prolonged disruption risks entrenching elevated inflation expectations. How events unfold from here will depend almost entirely on the timeline of the disruption. In either scenario, portfolio duration and credit quality are the levers most worth watching.

Trends Worth Noting

  • The AI investment cycle has not been disrupted by the selloff: The March drawdown was a macro event, not an AI story, and the distinction matters. AI capex commitments from major technology companies have not reversed and earnings from the tech sector are expected to significantly outpace the rest of the market. The risk is not that AI investment collapses; the risk is that a prolonged energy shock delays the translation of that investment into bottom-line results.11
  • Earnings resilience is holding: Despite the market selloff, the fundamental earnings backdrop has not broken down. S&P 500 companies are expected to report double-digit earnings growth for a sixth consecutive quarter in Q1 2026, with FactSet’s blended estimate at 13.2% year-over-year as of early April. Energy sector earnings revisions have turned sharply positive. The broader question entering the second quarter is whether oil-driven cost pressures and weakening consumer confidence begin to show up in guidance. 11, 13
  • Stagflation concerns are rising: The combination of energy-driven inflation and softening growth data has put the S-word back on investors’ radar. February job openings fell to 6.88 million, with the hires rate dropping to 3.1%. This was the lowest since the early months of the pandemic and may be an indication that the labor market is losing momentum. What distinguishes the current episode from the 1970s analogy, at least for now, is that longer-term inflation expectations remain well anchored, and corporate earnings have not yet deteriorated. If either deteriorates, stagflation could be on the horizon.12


The Takeaway

The Strait of Hormuz crisis triggered a selloff that cut across styles, market capitalizations, and sectors as a sudden repricing of inflation and growth simultaneously overwhelmed the reallocation logic that normally drives market rotation. The Fed is navigating a dual-mandate conflict with limited room to maneuver, earnings have held up but the economic landscape is changing, and the resolution of the energy shock depends on a variable no economic model can forecast. What the Trends and Implications described above share is that they were in motion before March and will outlast it: the stagflation debate, the AI capex cycle, and the argument for geographic diversification are not products of one difficult month. Patience, breadth, and a bias toward quality remain the prudent investment philosophy.


RETURNS OF MARKET INDICES

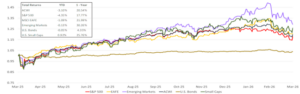
Global equity markets saw large declines in March as a whole (MSCI ACWI -7.1%) led by Emerging Markets (MSCI Emerging Market Equity Index -13%). U.S. large caps (S&P 500) fared better during this period but were still down 5%, in line with U.S. small caps (Russell 2000 -5%). International developed (MSCI EAFE) equities fell 10%. Bonds declined by 1.8% for the month.  YTD returns are shown in the chart below.14

Sources
  1. U.S. Congressional Research Service, “Iran Conflict and the Strait of Hormuz: Impacts on Oil, Gas, and Other Commodities,” R45281, updated March 2026. Approximately 27% of world maritime oil trade transits the Strait; 2024 volumes approximately 20 million barrels per day.
  2. CNBC, “Brent oil closes at $100 after Iran’s new supreme leader says Strait of Hormuz must remain closed,” March 12, 2026; CNBC, “Front-month Brent oil futures extend gains after record monthly rise in March,” April 1, 2026 (citing LSEG data). Brent closed above $100 on March 12; reached an intramonth high before easing; Brent monthly gain approximately 64%, a record per LSEG data dating to 1988. WTI gained approximately 51% in March, best month since May 2020.
  3. International Energy Agency, Oil Market Report, March 2026. Characterized as the largest supply disruption in the history of the global oil market. Global oil supply projected to fall approximately 8 mb/d in March. Brent futures traded within a whisker of $120/bbl at intramonth high.
  4. S&P Global Market Intelligence, “US REIT stocks outperform broader stock market in Q1 2026,” April 2026 (citing S&P Dow Jones Indices data as of March 31, 2026): S&P 500 Q1 2026 total return -4.3%. Russell style and size returns from Confluence Financial Partners, “First Quarter 2026 Market Recap,” April 2026, citing Morningstar and FTSE Russell data as of March 31, 2026: Russell 1000 Growth -9.78%; Russell 1000 Value +2.10%; Russell 2000 +0.89%.
  5. Federal Reserve, H.15 Selected Interest Rates (federalreserve.gov). 10-year Treasury constant maturity: approximately 4.15% at February 28 month-end, 4.43% as of March 27. Bloomberg U.S. Aggregate Bond Index: fell -1.76% in March; Q1 2026 total return -0.05%, per Confluence Financial Partners, “First Quarter 2026 Market Recap,” April 2026, citing Bloomberg data as of March 31, 2026.
  6. IEA, Oil Market Report, March 2026. OPEC+ spare capacity approximately 3.5 mb/d. IEA coordinated emergency stock release; U.S. Energy Secretary Chris Wright indicated a release that could approach 3 mb/d per CNBC, March 12, 2026.
  7. Federal Reserve, “Federal Reserve Issues FOMC Statement,” March 18, 2026; Federal Reserve, Summary of Economic Projections, March 18, 2026. Federal funds rate held at 3.50%-3.75%; 11-to-1 vote.
  8. Federal Reserve, Summary of Economic Projections, March 18, 2026. GDP median revised to 2.4% for 2026; PCE inflation median revised to 2.7% for 2026 (+0.3 percentage points vs. December 2025 projections). Median end-2026 federal funds rate projection 3.4%, implying approximately one additional 25 basis point cut.
  9. CNBC, “Fed Interest Rate Decision March 2026,” March 18, 2026; Kiplinger, “March Fed Meeting: Updates and Commentary,” March 18, 2026. Seven of 19 FOMC participants projected no cut in 2026.
  10. Bureau of Labor Statistics, Consumer Price Index Summary, February 2026 (bls.gov). February CPI +2.4% year-over-year; January CPI +2.4% year-over-year (down from 2.7% in December 2025); core CPI (all items less food and energy) +2.5% year-over-year.
  11. FactSet, Earnings Insight, week of April 2, 2026 (insight.factset.com). Q1 2026 blended EPS growth estimate: 13.2% year-over-year, which would mark the sixth consecutive quarter of double-digit earnings growth. Energy and Information Technology sectors recorded the largest upward EPS revisions since December 31.
  12. Bureau of Labor Statistics, Job Openings and Labor Turnover Survey (JOLTS), March 2026 release (bls.gov), reporting February 2026 data. Job openings fell 358,000 to 6.882 million at end of February 2026. U.S. EIA Short-Term Energy Outlook, March 2026 (eia.gov): gasoline prices forecast approximately 60 cents/gallon higher in March due to higher crude prices; national average exceeded $4/gallon by end of March per TPFG Market Pulse March 2026 (citing Bloomberg).
  13. S&P Global Market Intelligence, “Global Economic Outlook: March 2026,” March 2026. U.S. and Canada characterized as net energy exporters facing relatively mitigated Hormuz economic impact. Index return figures cross-referenced against endnote 4.
  14. Bloomberg. Returns of Market Indices chart data as of March 31, 2026. EAFE is MSCI EAFE Index; Emerging Markets is MSCI Emerging Markets Index; U.S. Bonds is Barclays U.S. Aggregate; ACWI is the MSCI ACWI Index; Small Caps is the Russell 2000 Index; S&P 500 is the S&P 500 Index. March 2026 returns shown.